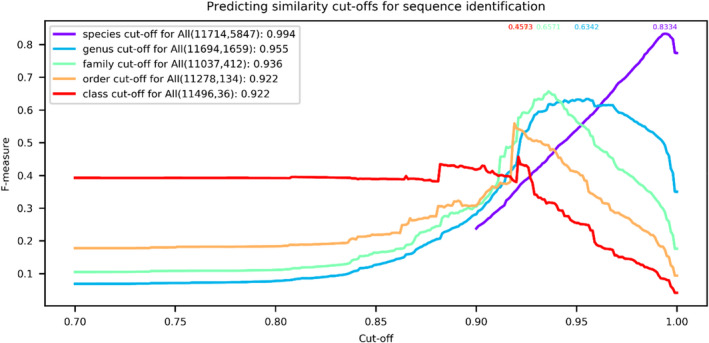
FIGURE 5.

The prediction of global similarity cutoffs for sequence identification at different taxonomic levels for the reference filamentous fungal CBS ITS barcode data set. The number of sequences and groups at the associated taxonomic level are given in parentheses. The global similarity cutoffs predicted for sequence identification at the associated taxonomic level are given to the right of the parentheses. The numbers above the curves are the highest confidence measures obtained for the global similarity cutoffs
