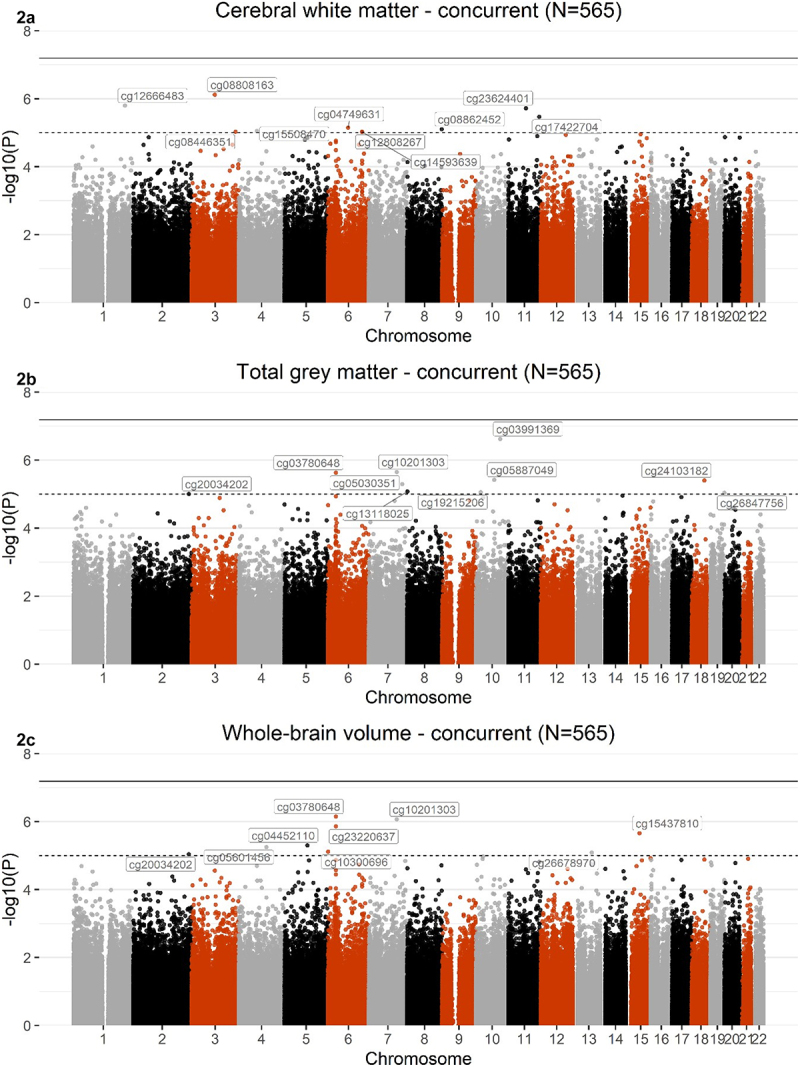
Figure 2.

Manhattan plots showing meta-analysis of EWAS of cerebral white matter (2A), total grey matter (2B), and whole-brain volume (2 C), across the 2 concurrent sets (Nset 1=331; Nset 2=234; Ntotal=565). The black line defines the threshold for epigenome-wide significance (p ≤ 6.5x10⁻⁸) and the dotted line defines p ≤ 1x10⁻⁵. CpGs that met a significance of p ≤ 1x10⁻⁵ are labelled on the graph.
