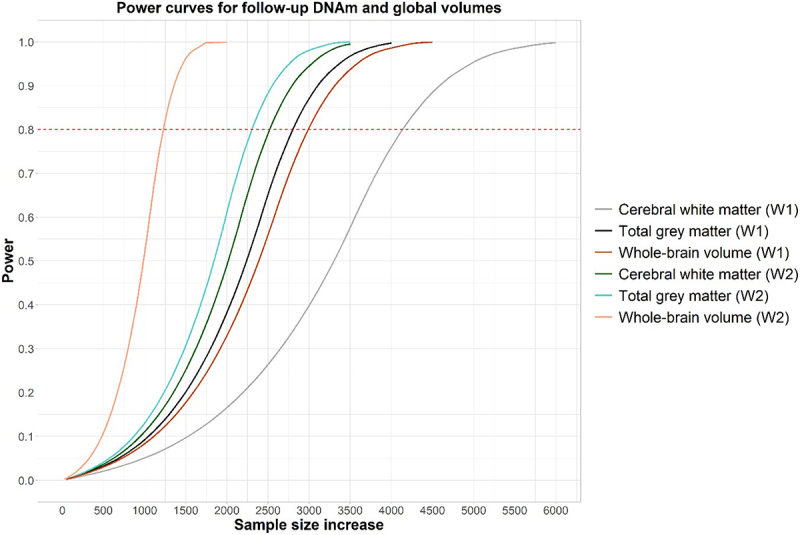
Figure 3.

Power curves for cerebral white matter, total grey matter, and whole-brain volume calculated separately for set 1 and set 2. The x-axis indicates how many participants would be needed to detect an effect with 60%, 80%, 90%, 95% or 99% power at p < 6.51x10⁻⁸ (set 1 (W1)) and p < 6.53x10⁻⁸ (set 2 (W2)) with 36 regression coefficients included in the linear model. Effect sizes were calculated based on the largest effect size obtained in EWAS for each phenotype at baseline.
