. 2022 Oct 5;14(1):2127172. doi: 10.1080/19420862.2022.2127172

Figure 5.

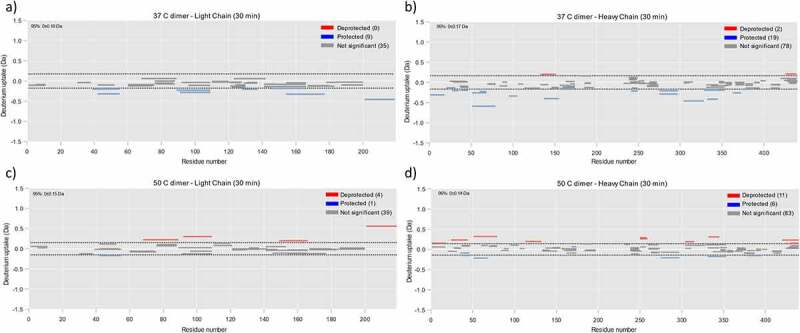
HDX-MS analysis of 37°C dimers and 50°C dimers. Woods plots showing differential deuterium uptake for dimer samples relative to mAb1. A) 37°C dimer light chain, showing multiple protected regions in the dimer sample. B) 37°C dimer heavy chain, showing multiple protected regions in the dimer sample. C) 50°C dimer light chain, fewer protected regions are observed compared to 37°C dimer. D) 50°C dimer heavy chain, fewer protected regions are observed compared to 37°C dimer.

HDX-MS analysis for identification of dimer interface. a) Deuterium uptake for the light chain of the 37C dimer relative to monomer. Peptides shown in blue and red correspond to those with a reduced and increased deuterium uptake, respectively. Dashed lines represent significance threshold from a two tailed T-test with 95% confidence b) As for A but for heavy chain of the 37C dimer. c) As for A but for light chain of the 50C dimer. d) As for A but for heavy chain of the 50C dimer.