
Figure 6.
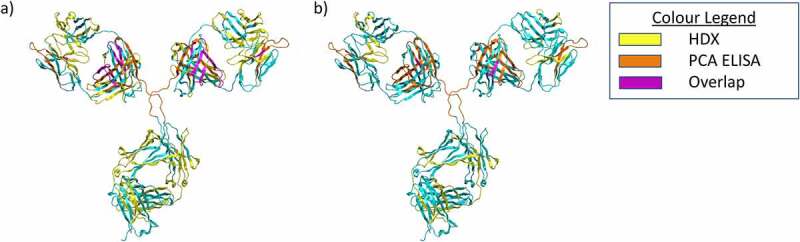
Summary of PCA ELISA and HDX data visualized using a homology model of mAb1. a) Results for HDX-MS and PCA ELISA for the 37C dimer sample. Residues which showed protection in the PCA ELISA are colored Orange, for the HDX protected residues are colored yellow. Residues which showed protection in both techniques are shown in purple. All other residues shown in cyan. b) Results for HDX-MS and PCA ELISA for the 50C dimer sample. Colors are the same as for A).