
FIGURE 3.
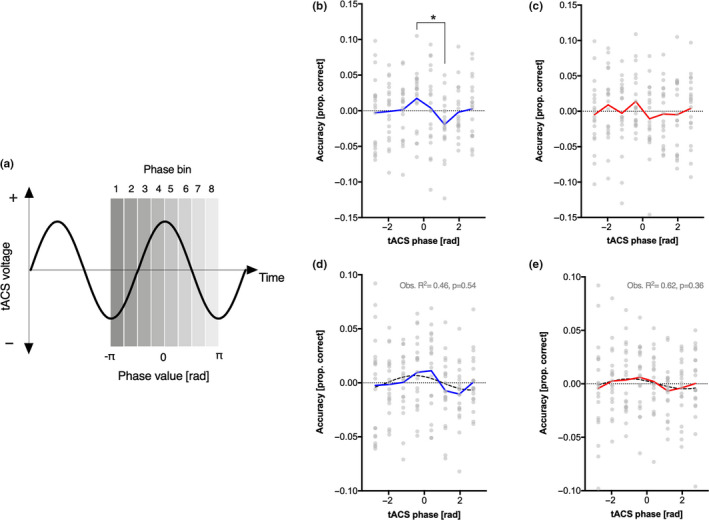
(a) Relationship between tACS voltage and phase bins/values extracted with a Hilbert transform; (b) Temporal integration and (c) segregation accuracy (raw values, centered on the individual mean) as a function of tACS phase bin (*=p<.05, Bonferroni‐corrected). (d) Temporal integration and (e) segregation accuracy (centered on the individual mean and smoothed with a moving average) as a function of tACS phase bin with superimposition (dotted line) of the best one cycle sinusoidal function; p‐values were obtained with permutation tests. See also FiguresS1‐S4for plots of individual data