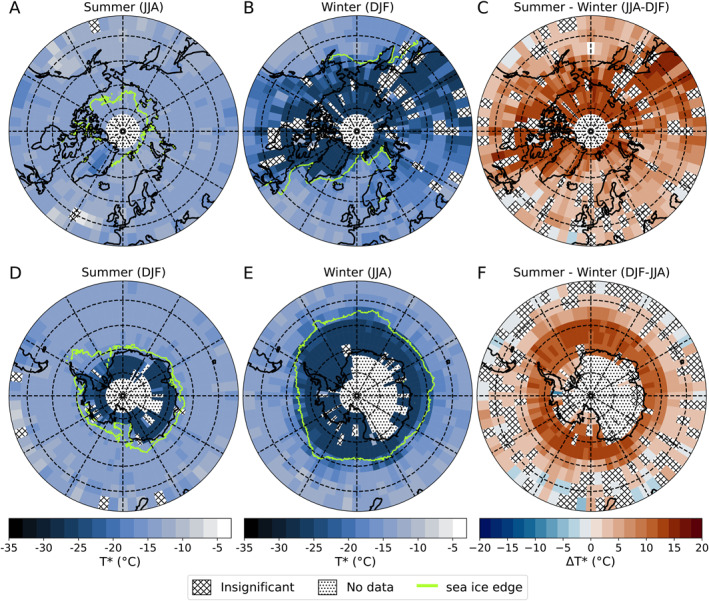
Figure 2.

Seasonal T* over the Arctic and the Southern Ocean based on observations between 2006 and 2017. Grid cells where T* calculations are insignificant (on a 99% confidence level) are hatched, while dotted areas have no data. The green line shows the average minimum/maximum sea ice edge between 2006 and 2017, defined as the 15% sea ice concentration line for the given season. Arctic T* during Summer (JJA), Winter (DJF) and the difference between Summer and Winter (Summer minus Winter) are shown in panel (a–c), respectively. Similarly, the Southern Ocean T* during Austral Summer (DJF), Winter (JJA) and the difference between Summer and Winter (Summer minus Winter) are shown in panel (d–f), respectively.
