
Figure 8.
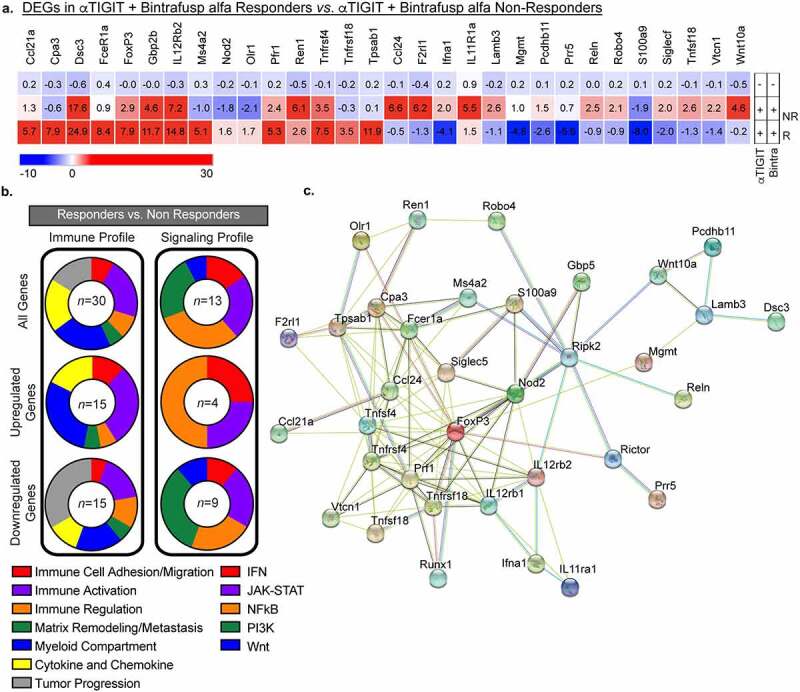
Differentially expressed genes between Responders and Non-Responders. (a) Heatmap of differentially expressed genes in tumors taken from animals treated with αTIGIT + bintrafusp alfa Non-Responders (n = 5), αTIGIT + bintrafusp alfa Responders (n = 3) in comparison to untreated animals (n = 5) as identified by the NanoString nCounter® PanCancer Pathways Panel. Mean fold change values are within each cell. This list represents DEGs from Responders that are statistically significant from untreated animals and Responders versus Non-Responders. (b) Graphical summary of function of DEGs (Left column – immune profile, right column – signaling profile) between Responders and Non-Responders. All genes are in the top row, upregulated genes in the middle row and downregulated genes are in the bottom row. Numbers in the middle of the pie charts indicate the number of differentially expressed genes. (c) STRING network of protein–protein interactions of DEGs between Responders and Non-Responders identified by NanoString.
Abbreviations: DEGs, differentially expressed genes; NR, Non-Responders; R, Responders.