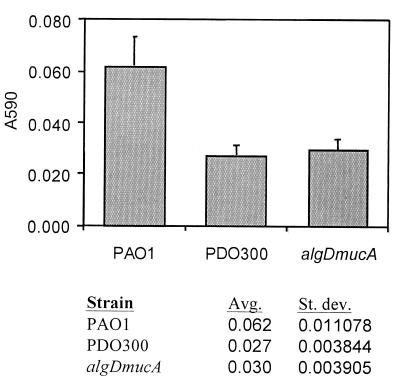
FIG. 2.
Biofilm formation assay comparing the total biofilm biomasses of PAO1, PDO300, and algDmucA strains after 10 h. Biofilms were prepared and stained as described in Materials and Methods. Both PDO300 and the algDmucA double mutant harbored less biomass in their biofilms than did PAO1. Each value was the average of 32 individual replicates. Avg, average; St. dev., standard deviation.

