
Figure 1.
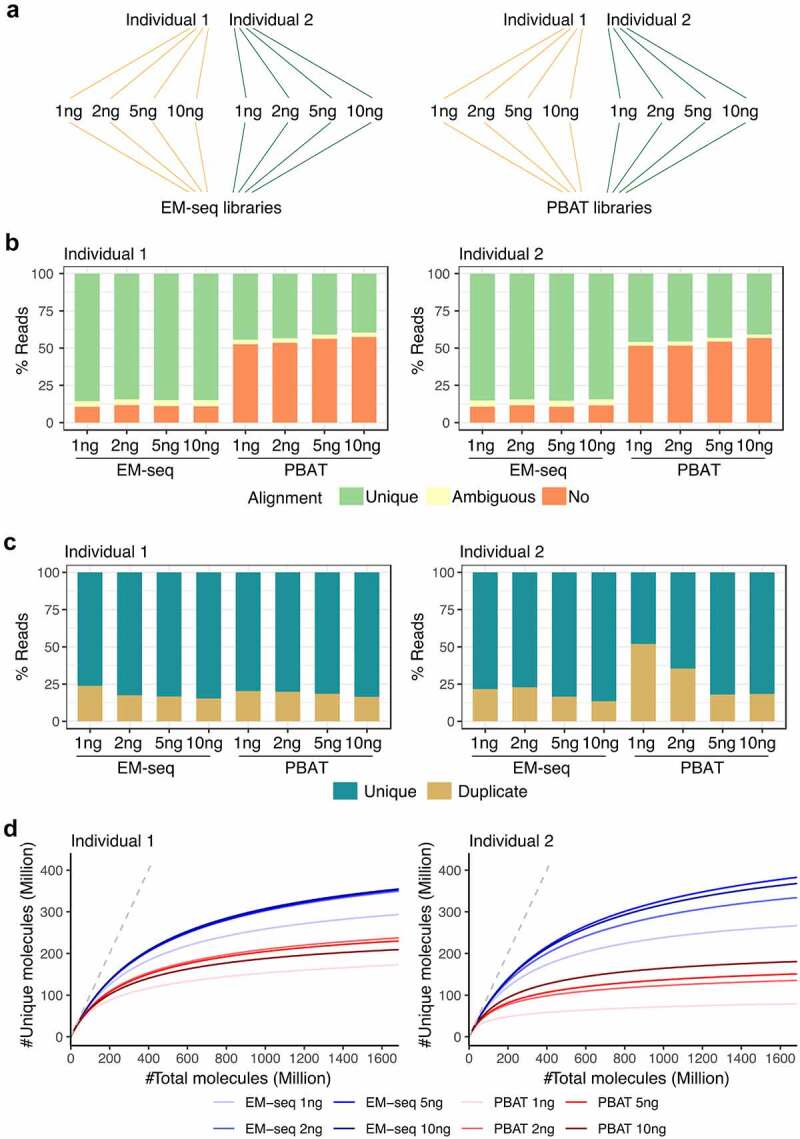
EM-seq libraries performed better in regards to library and sequencing quality. (a) Samples from two individuals (yellow and green) were collected and split into two for EM-seq and PBAT libraries, respectively. Each method included 1, 2, 5 and 10ng input amounts. (b) Stacked bar plots illustrate unique (green), ambiguous (yellow) and no (orange) alignment based on % reads. (c) Illustration of unique (dark turquoise) and duplicate (yellow) reads. (d) Complexity curves of EM-seq (blue) and PBAT (red) library methods. The dashed grey line illustrates maximum library complexity.