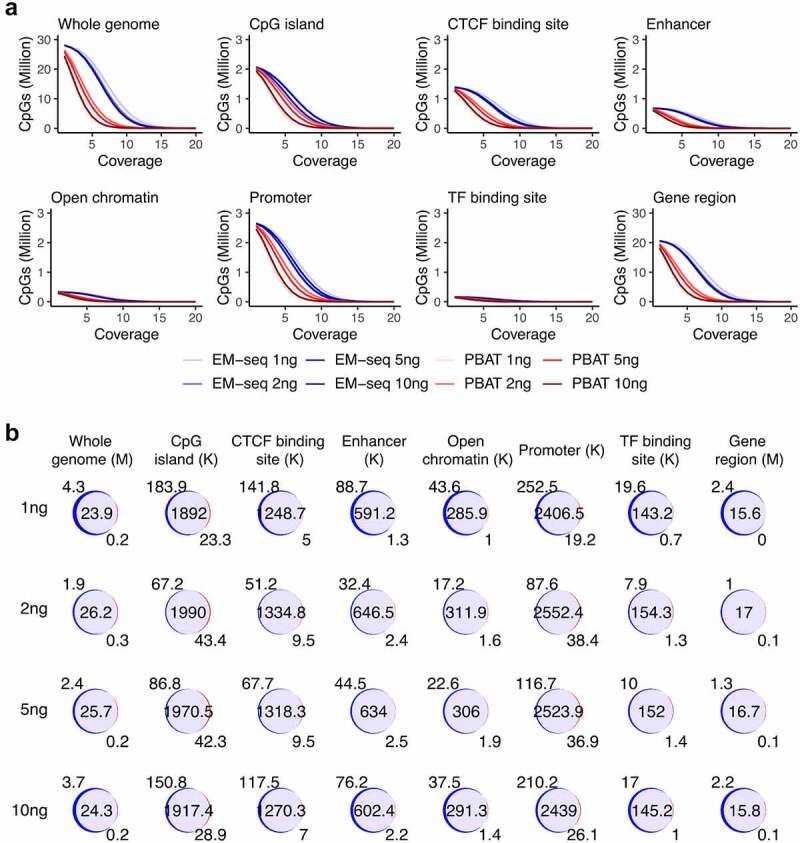
Figure 2.

CpG coverage and overlap. (a) Number of CpG sites and sequencing coverage in EM-seq (blue) and PBAT (red) for all input amounts for individual 1 encompassing whole genome and genomic features such as CpG islands, CTCF binding sites, enhancers, open chromatin, promoters, transcript factor (TF) binding sites and gene regions. (b) Overlap (purple) of EM-seq (blue) and PBAT (red) CpG sites from input amounts of 1, 2, 5 and 10ng in individual 1. M (million) for whole genome and gene region, K (thousand) for other features.
