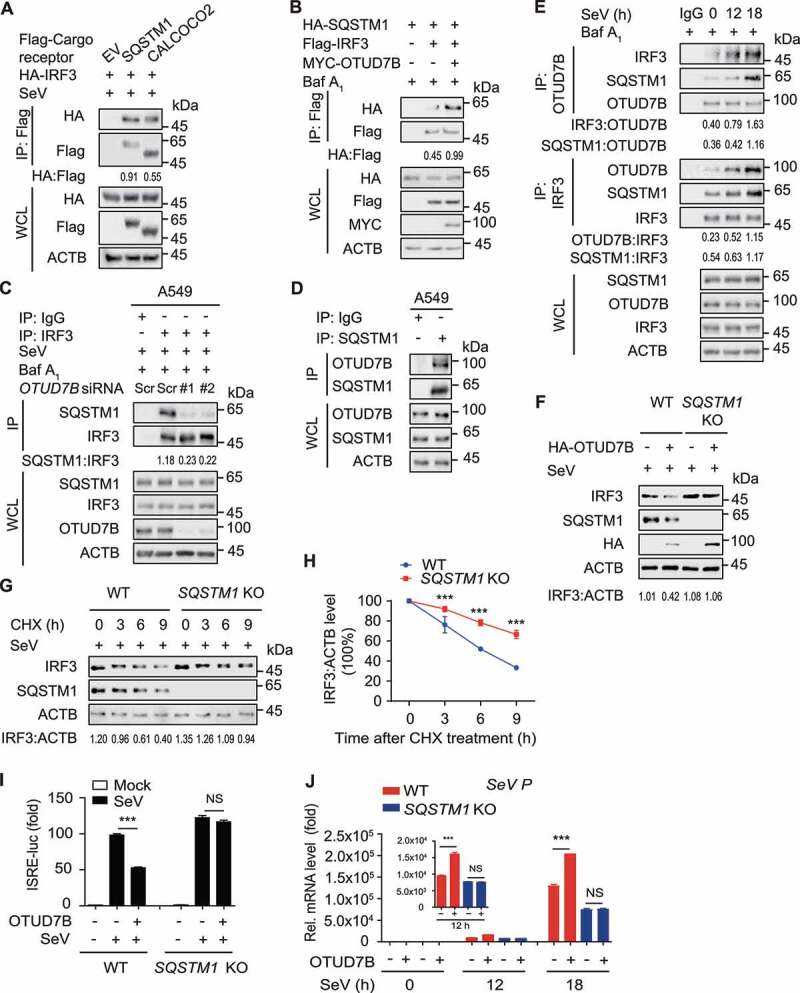
Figure 4.

OTUD7B promotes the SQSTM1-mediated IRF3 degradation. (A) 293 T cells were transfected with vectors encoding HA-IRF3, together with Flag-tagged SQSTM1 and CALCOCO2, followed by SeV (MOI = 0.1) infection for 18 h. Protein lysates were harvested for immunoprecipitation with anti-Flag beads and immunoblot analysis with anti-HA. (B) 293 T cells were transfected with vectors encoding HA-SQSTM1 and Flag-IRF3, together with MYC-OTUD7B. Protein lysates were harvested after bafilomycin A1 (Baf A1) (0.2 μM) treatment (6 h) for immunoprecipitation with anti-Flag beads and immunoblot analysis with anti-HA. (C) A549 cells were transfected with scrambled (Scr) siRNA or OTUD7B siRNAs, followed by SeV (MOI = 0.1) infection for 12 h. Protein lysates were harvested after Baf A1 (0.2 μM) treatment (6 h) for immunoprecipitation and immunoblot using indicated antibodies. (D) Protein lysates of A549 cells were immunoprecipitated with anti-SQSTM1 antibody and immunoblot analysis with indicated antibodies. (E) A549 cells were treated with SeV (MOI = 0.1) infection for indicated time points. Protein lysates were harvested after Baf A1 (0.2 μM) treatment (6 h) for immunoprecipitation and immunoblot using indicated antibodies. (F) Protein lysates of wild-type (WT) and SQSTM1 knockout (KO) 293 T cells transfected with plasmids encoding empty vector (EV) or HA-OTUD7B, followed by SeV (MOI = 0.1) infection for 12 h were immunoblotted with the indicated antibodies. (G) Protein lysates of WT and SQSTM1 KO 293 T cells infected with SeV (MOI = 0.1) for 18 h, followed by cycloheximide (CHX) (100 μg/mL) treatment for the indicated time points, were immunoblotted with the indicated antibodies. (H) Quantification of the expression levels of IRF3 shown in (G). (I) Luciferase activity in WT or SQSTM1 KO 293 T cells transfected with an ISRE promoter-driven luciferase reporter, together with EV or expression vector for HA-OTUD7B, followed by SeV (MOI = 0.1) infection for 12 h. (J) Quantitative RT-PCR analysis of indicated gene expression in WT or SQSTM1 KO 293 T cells transfected with plasmids encoding EV or HA-OTUD7B, followed by SeV (MOI = 0.1) infection for indicated time points. In (H-J), all error bars, mean values ± SEM, P-values were determined by unpaired two-tailed Student’s t test of n = 3 independent biological experiments, *** P < 0.001. NS: not significant. For (A-G), similar results are obtained for three independent biological experiments.
