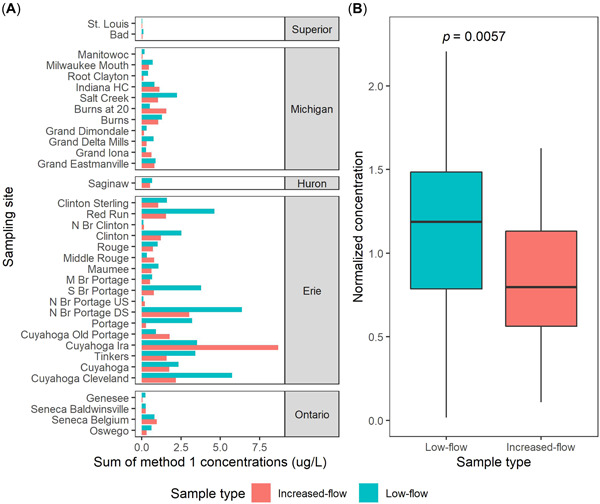
Figure 2.

Summation of concentrations of Method 1 pharmaceuticals detected in Great Lakes tributary sampling sites, October 2017–September 2018. (A) Bar plot of concentrations grouped by site and separated based on the relative mean daily flow conditions present on sample collection dates. (B) Boxplots of summations of Method 1 pharmaceutical concentrations normalized by mean sample concentrations from individual sites. Mean normalized concentrations showed a significant difference (p < 0.05) between low‐flow and increased‐flow samples, according to Welch's two‐sample t test. Boxes depict the first through third quartiles; dark line, median; whiskers, data within 1.5 times the interquartile range. HC = Harbor Canal; N Br = North Branch; M Br = Middle Branch; S Br = South Branch; US = upstream; DS = downstream.
