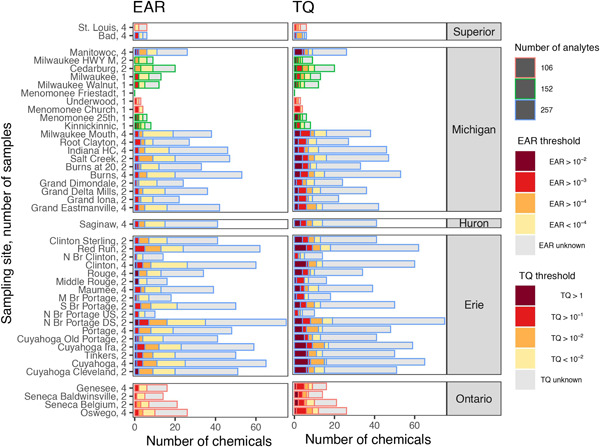
Figure 5.

Pharmaceutical detections and exceedances of incremental hazard quotient thresholds for ToxCast exposure–activity ratios (left) and ECOTOX‐derived toxicity quotients (right), organized by sampling site. The number of pharmaceuticals detected at each site is represented by the combination of stacked bars (e.g., 60 pharmaceuticals were detected at Clinton). The number of pharmaceuticals monitored at each site is indicated by the border color of the respective bar (e.g., 257 pharmaceuticals were monitored at Clinton). The number of samples collected from each of the 44 Great Lakes tributary sampling sites, October 2017–September 2018, is listed following the site name. EAR = exposure–activity ratio; TQ = toxicity quotient; HWY = highway; HC = Harbor Canal; N Br = North Branch; M Br = Middle Branch; S Br = South Branch; US = upstream; DS = downstream.
