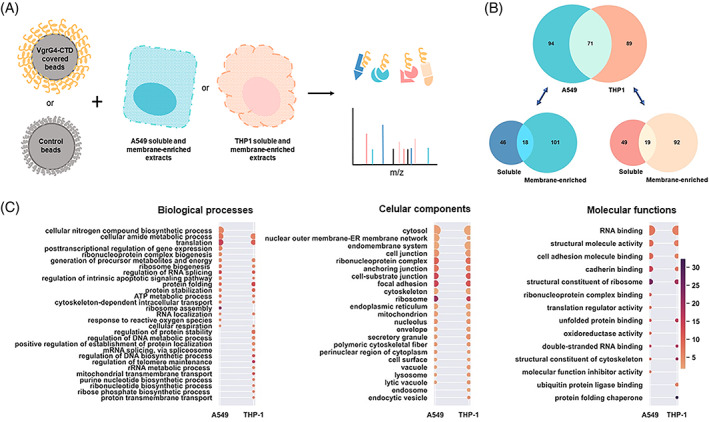
FIGURE 2.

VgrG4‐CTD ligands. (A) Methodological approach used to characterize the VgrG4‐CTD interactome network. Briefly, latex beads covered with VgrG4‐CTD were incubated with A549 or THP‐1 proteins extracts (soluble and membrane‐enriched fractions). Bound proteins were eluted, and mass spectrometry identified. (B) Venn diagrams showing the number of proteins identified in each sample. (C) Gene ontology terms enriched in A549 or THP‐1 putative ligands of VgrG4‐CTD. Terms associated to biological processes, cellular components and molecular functions are shown. The size of the circles are proportional to the number of proteins associated to the term (ranging from 7 to 113), and the color scale is related to the enrichment factor (from 1.7 to 32).
