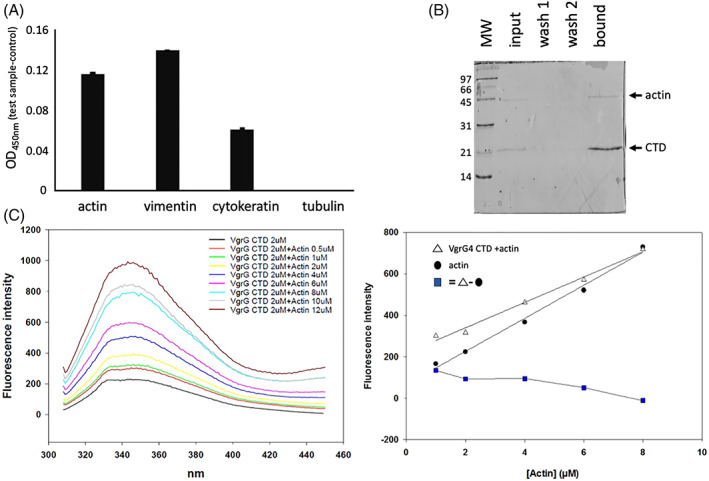
FIGURE 4.

VgrG4‐CTD interacts with actin and other cytoskeleton structural proteins. (A) VgrG4‐CTD was adsorbed in microplate wells. Empty binding sites were blocked with BSA. THP‐1 protein extracts were incubated. Nonbound proteins were washed. Actin, tubulin, cytokeratin and vimentin primary antibodies were used to detect them. Secondary antibody conjugated with peroxidase and TMB substrate were added to reveal the interaction. Increased values at 450 nm indicate higher amounts of protein bound. (B) Purified actin was mixed with the recombinant VgrG4‐CTD‐His6 and then incubated with Ni2+‐affinity resin. The input, washes, and elution samples were analyzed by SDS‐PAGE. Low‐range molecular weight (Biorad) is shown (kDa). (C) Fluorescence spectrum of VgrG4‐CTD incubated with increasing concentration of actin. The correlation between actin concentration and the peak of fluorescence emission is shown. White triangles curve represent the fluorescence intensity of the different Actin concentrations with VgrG4‐CTD. Black circles curve denotes pure actin. Blue squares indicate the subtraction of free actin intensity values from the titration curve of actin with VgrG4‐CTD.
