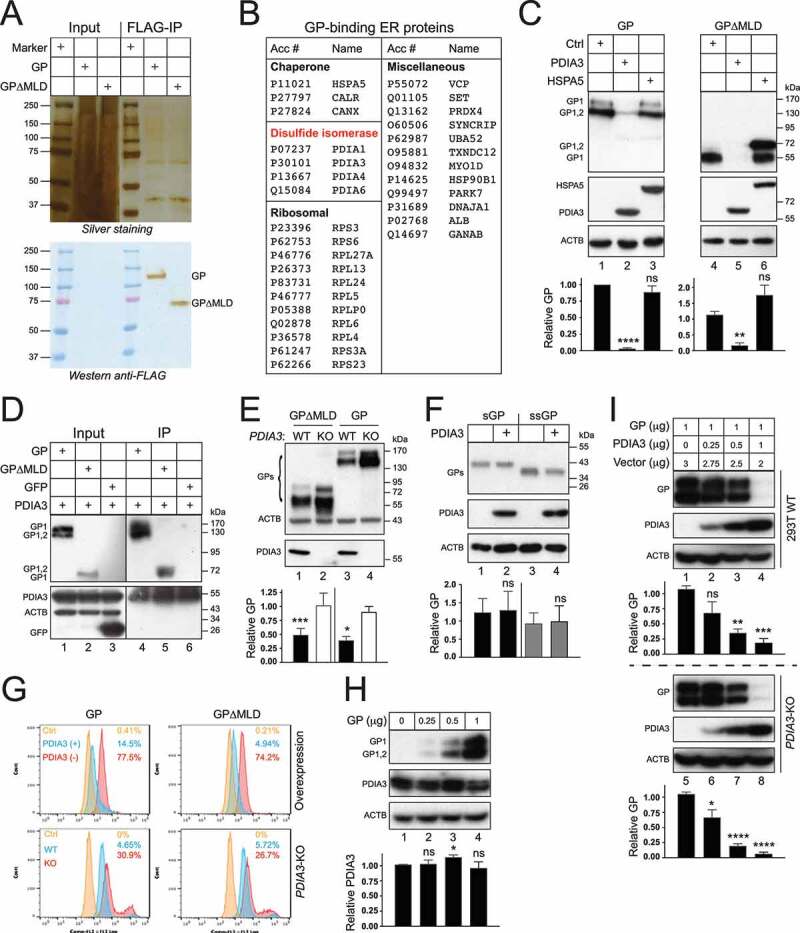
Figure 1.

Identification of ER proteins that interact with the EBOV structural GP. (a) FLAG-tagged EBOV-GP and EBOV-GP∆MLD were expressed in HEK293T cells and purified with an anti-FLAG affinity column. Purified proteins were analyzed by SDS-PAGE followed by silver staining (top gel) or WB (bottom gel). (b) Affinity-purified EBOV glycoprotein complexes were analyzed by liquid chromatography tandem mass spectrometry (LC-MS/MS). Identified ER proteins that interact with both GP and GP∆MLD are listed. (c) GP and GP∆MLD with a N-terminal FLAG-tag were expressed with PDIA3/ERp57 or HSPA5/BiP in HEK293T cells, and their expression was determined by WB. (d) Flag-tagged GP, GP∆MLD, and GFP were expressed with PDIA3 and pulled down by anti-PDIA3. Proteins in cell lysate and immunoprecipitation (IP) samples were determined by WB. (e) GP and GP∆MLD were expressed in HEK293T WT and PDIA3-KO cells and their expression was determined by WB. (f) sGP and ssGP with a N-terminal HiBiT-tag were expressed with PDIA3 in HEK293T cells, and their expression was determined by the Nano-Glo® HiBiT Blotting System. (g) HEK293T cells were transfected with 1 μg PDIA3 and 1 μg GP or GP∆MLD expression vectors. Alternatively, HEK293T WT and PDIA3-KO cells were transfected with 1 μg GP or GP∆MLD expression vectors. GP expression on the cell surface was determined by flow cytometry. (h) HEK293T cells were transfected with increasing amounts of a GP expression vector. GP and the endogenous PDIA3 expression were determined by WB. (i) HEK293T WT and PDIA3-KO cells were transfected with 1 μg GP expression vector and increasing amounts of an PDIA3 expression vector. GP and PDIA3 expression were detected by WB. The levels of GP expression in C, E, F, and I, and those of PDIA3 expression in H were further quantified from these Western blots by ImageJ and are presented under each of these blots. Results are shown as relative values, with the value from a control (Ctrl) vector set as 1. Error bars represent the standard error of measurements (SEMs) calculated from three experiments. *p < 0.05, **p < 0.01, ***p < 0.001, ****p < 0.0001, ns (not significant, p > 0.05).
