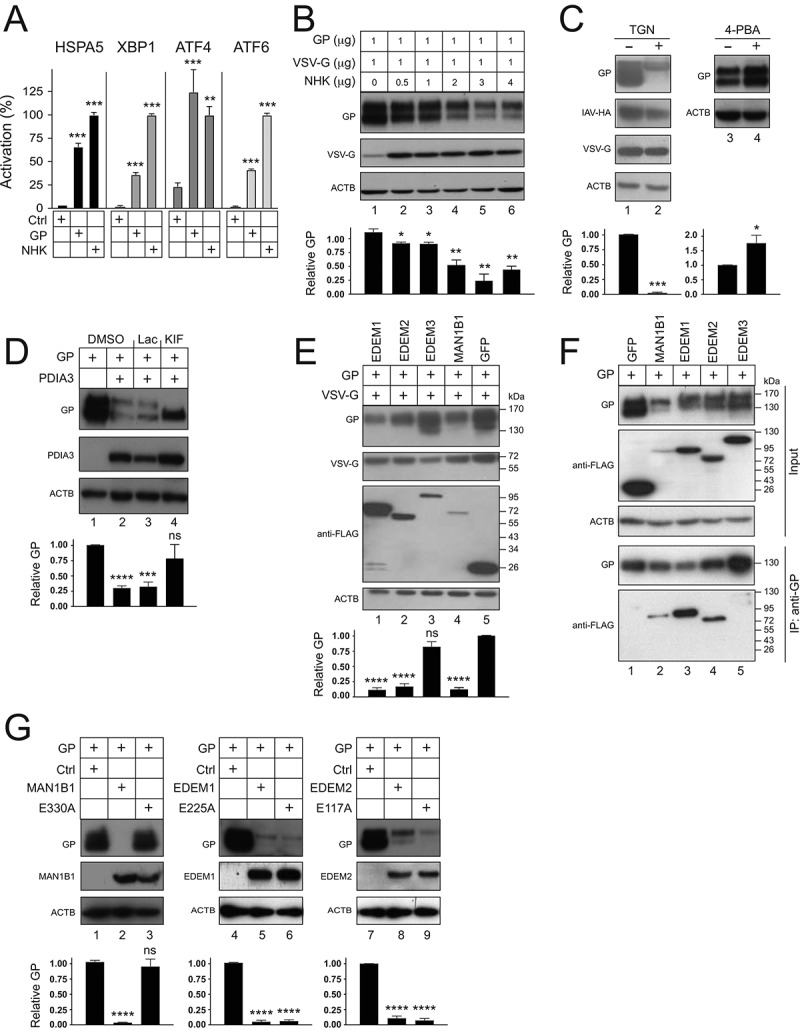
Figure 4.

EBOV-GP induces UPR and is targeted by ERAD machinery. (a) HEK293T cells were transfected with a GP or SERPINA1 expression vector and pLightSwitch-BiP, pXBP1u-FLuc, pATF4-UTR-Fluc, or p5× ATF6-GL3. Luciferase activities were measured and are presented as relative values, with the activities in the presence of SERPINA1 normalized to 100%. (b) GP and VSV-G were expressed in HEK293T cells with increasing amounts of SERPINA1 and their expression was analyzed by WB. (c) GP, IAV-HA, and VSV-G were expressed with PDIA3 in HEK293T cells and treated with 0.1 µM thapsigargin (TGN). In addition, GP was expressed with PDIA3 and treated with 1 mM 4-phenylbutyrate (4-PBA). DMSO was used as a vehicle control. Viral protein expression was analyzed by WB. (d) GP and PDIA3 were expressed in HEK293T cells and treated with 20 μM lactacystin (Lac) or 50 μM kifunensine (KIF). DMSO was used as a vehicle control. GP expression was analyzed by WB. (e) GP and VSV-G were expressed with EDEM1, EDEM2, EDEM3, or MAN1B1 in HEK293T cells and their expression was analyzed by WB. GFP was used as a control. EDEM1, EDEM2, EDEM3, MAN1B1, and GFP were detected by an anti-FLAG. (f) GP was expressed with FLAG-tagged GFP, MAN1B1, EDEM1, EDEM2, or EDEM3 in HEK293T cells. Proteins were pulled down by anti-GP and analyzed by WB. (G) GP was expressed with MAN1B1, EDEM1, EDEM2, and their catalytic site-deficient mutants in HEK293T cells, and their expression was analyzed by WB. The levels of GP expression in B, C, D, E, and G were further quantified. Error bars represent SEMs calculated from three independent experiments. *p < 0.05, **p < 0.01, ***p < 0.001, ****p < 0.0001, ns (p > 0.05).
