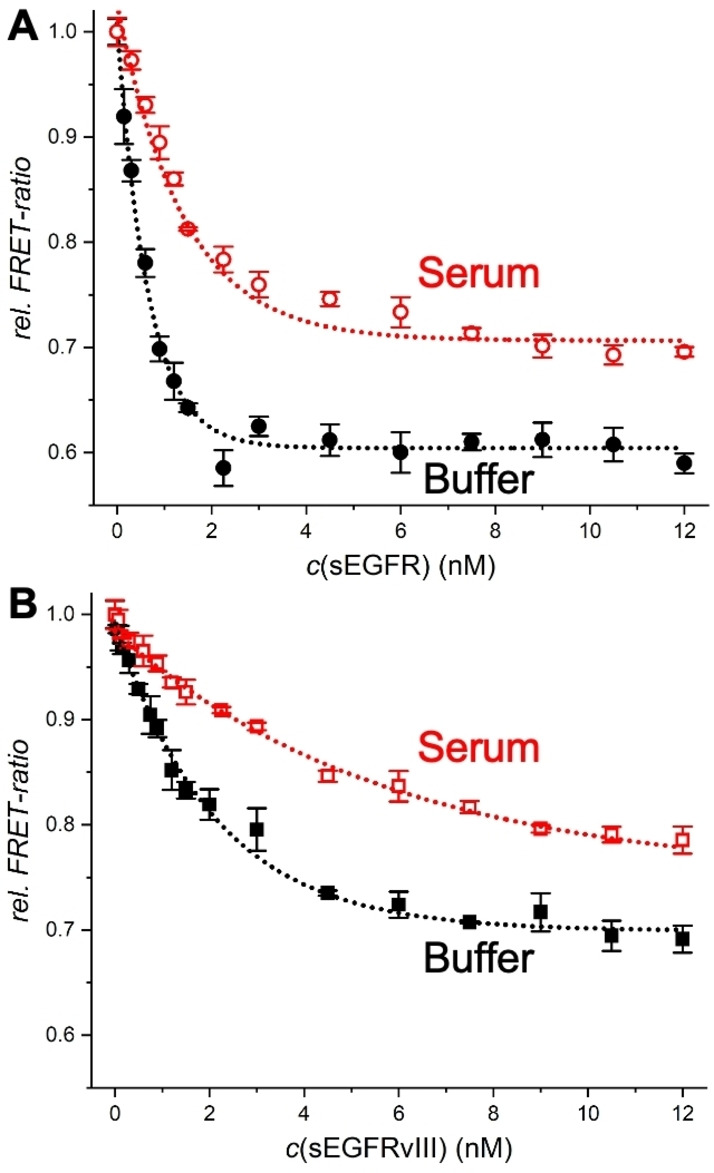
Figure 3.

Comparison of NB displacement immunoassays for sEGFR (A) and sEGFRvIII (B) in serum (20 vol %) and buffer. Data points represent three (10 for the blank samples without sEGFR) independent measurements. Error bars represent standard deviations (σ). The EGFR concentrations are those in the 50 μL sample.
