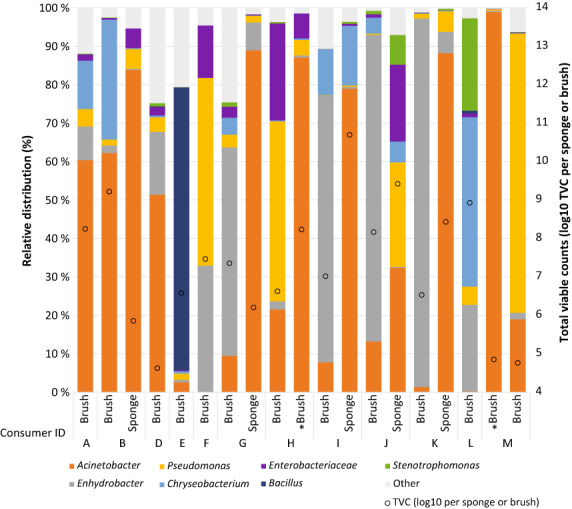
FIGURE 1.

Bacterial diversity in brushes and sponges collected from Norwegian consumers (A–M). Only taxa that were above 0.1% across all items are indicated, the remaining taxa are shown together as “Other.” Some consumers provided two cleaning utensils. Consumers H and M provided two brushes where one (marked *) was used to clean very dirty dishes. Total viable counts (log10 TVC) per brush/sponge are shown as circles. One brush and one sponge are not included in the figure due to non‐successful amplification.
