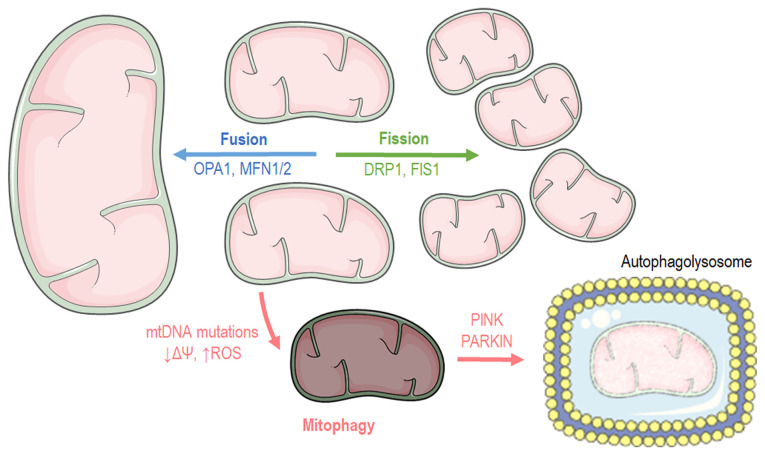
Figure 2.
Graphical illustration depicting mitochondrial dynamics and mitophagy processes. The image was created using the Smart servier medical art website; smart.servier.com. mtDNA, mitochondrial DNA; OPA1, optic atrophy 1; MFN, mitofusin; DRP1, dynamin-related protein 1; PINK1, PTEN-induced kinase 1.

