
Fig. 8.
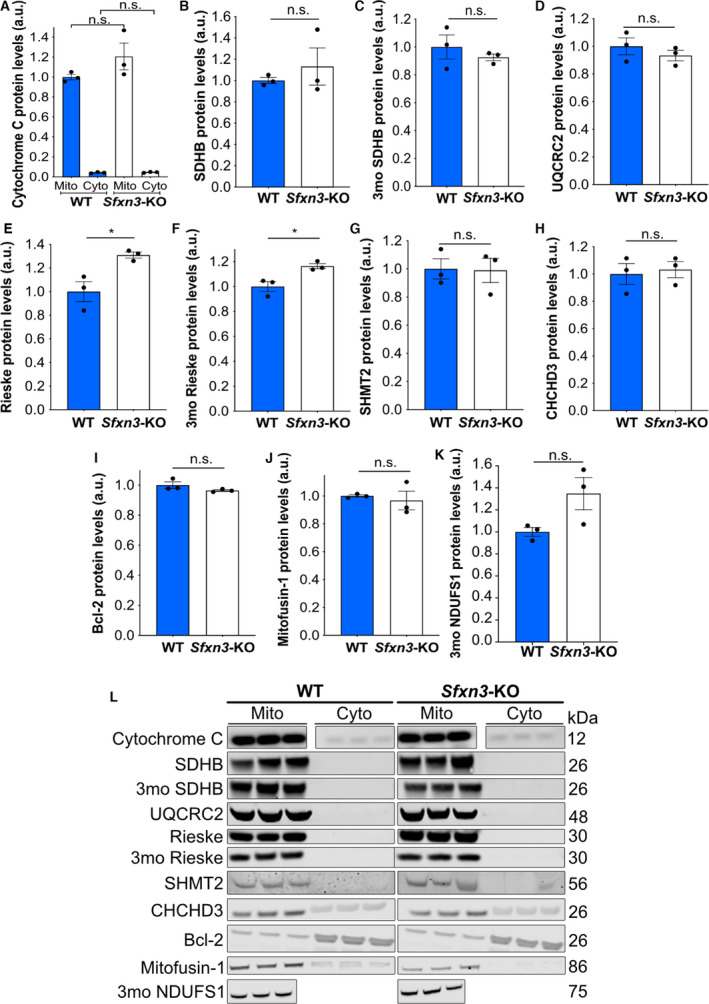
Molecular characterisation of 3‐month‐old and 1‐year‐old Sfxn3‐KO mice. (A, B, D, E, G–J) Quantification of Cytochrome C (mitochondria comparison had a P = 0.22 and cytoplasm comparison had a P > 0.99), OXPHOS Complex II/SDHB (P > 0.99), OXPHOS Complex III/UQCRC2(P = 0.40), Rieske (P = 0.02), SHMT2 (P = 0.93), CHCHD3 (P = 0.75), Bcl‐2 (P = 0.18) and Mitofusin‐1 (P = 0.70) in mitochondrial and cytoplasmic fractions of WT and Sfxn3‐KO mouse brains at 1‐year of age. (C, F, K) Quantification of OXPHOS Complex II/SDHB (P = 0.45) and Rieske (P = 0.02) in mitochondrial and cytoplasmic brain fractions and NDUFS1 (P = 0.08) in brain protein lysate from WT and Sfxn3‐KO mice at 3‐months‐old (3mo). (A) N = 3, n.s. = P > 0.05 in one‐way ANOVA with a Tukey’s multiple comparison test. (B, J) N = 3, n.s. = P > 0.05 in Mann‐Whitney U test. (C–I, K) N = 3, n.s. = P > 0.05 and *P < 0.05 in two‐tailed unpaired t‐test. (A–K) Graphs plotted as mean ± SEM. (L) Immunoblot protein bands for Cytochrome C, OXPHOS Complex II/SDHB, OXPHOS Complex III/UQCRC2, Rieske, SHMT2, CHCHD3, Bcl‐2, Mitofusin‐1 in mitochondrial and cytoplasmic fractions of WT and Sfxn3‐KO mouse brains at 1‐year of age. Immunoblot protein bands for OXPHOS Complex II/SDHB and Rieske in mitochondrial and cytoplasmic brain fractions and NDUFS1 in brain protein lysate in WT and Sfxn3‐KO mice at 3‐months‐old (3mo) are also shown. Respective molecular weights in kDa are shown on the right‐hand side of the panel.