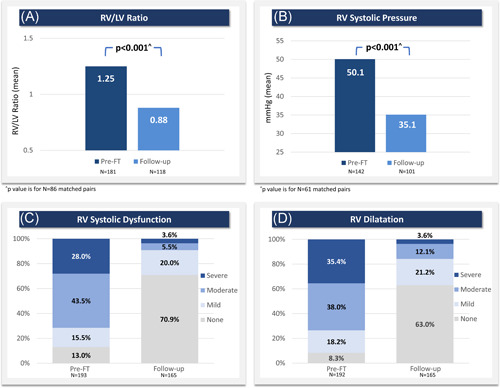
Figure 4.

Improved RV size and function assessed via echocardiography. (A) Mean RV/LV ratio, (B) mean RV systolic pressure, (C) RV systolic dysfunction grades, and (D) RV dilatation grades each showed significant improvement at follow‐up, which represents a composite of the latest assessment available for each subject. Median follow‐up time was 32.0–33.5 days, depending on the variable. In (A) and (B), all available preprocedure and follow‐up data are shown, though statistical comparisons are limited to patients with paired assessments (RV/LV ratio: n = 86 with mean difference of −0.36; RV systolic pressure: n = 61 with mean difference of −19.1 mmHg). p values are calculated from Wilcoxon signed‐rank tests. FT, FlowTriever; LV, left ventricle; RV, right ventricle [Color figure can be viewed at wileyonlinelibrary.com]
