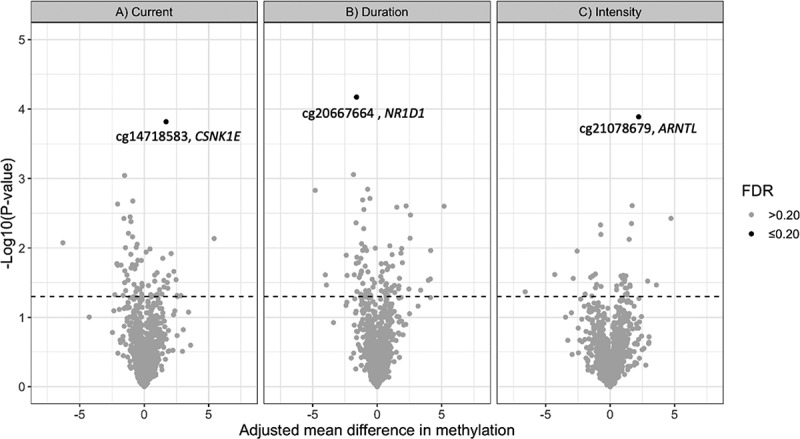
Figure 1.

Volcano plot of results from the analysis of 1150 CpG loci across 22 circadian genes in association with A) current night shift work vs. day work, B) night shift work duration (≥10 years vs. <10 years) and C) night shift intensity (≥3 consecutive night shifts/week vs. <3 night shifts/week). The figure plots p-values versus the effect size (adjusted mean difference in methylation β-values). Dotted line represents p = 0.05. Loci with FDR ≤0.20 are highlighted.
