
FIGURE 1.
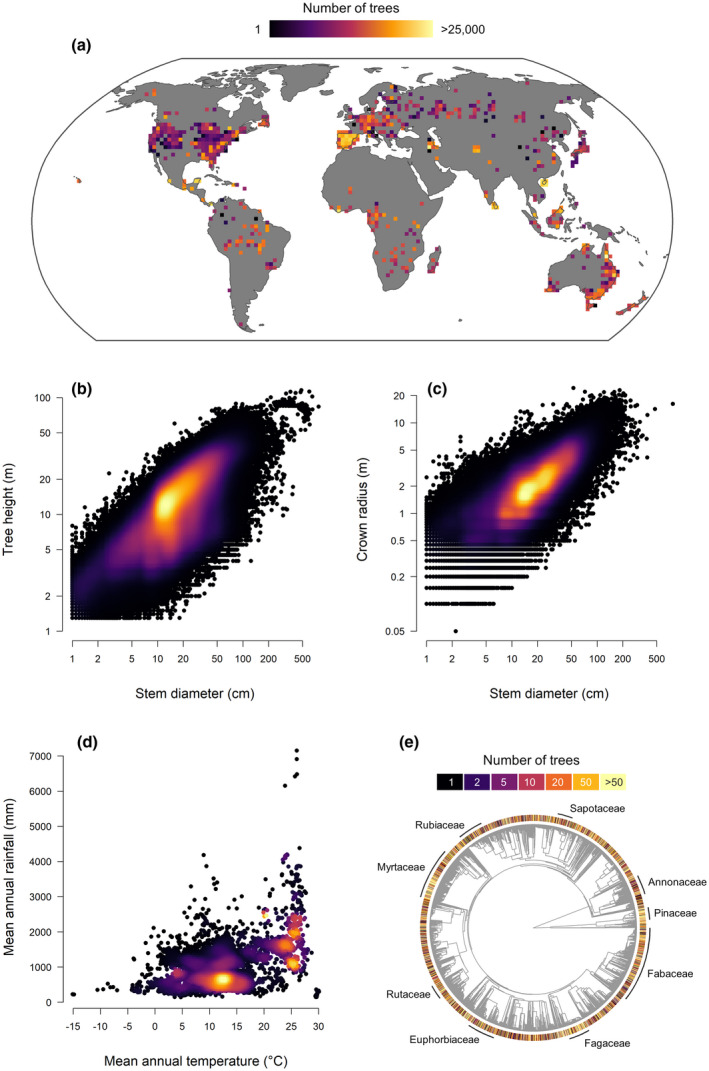
Overview of the Tallo database, including (a) geographical coverage, (b–c) size range of sampled trees, (d) climatic range of the data and (e) taxonomic coverage in phylogenetic space. Panel (a) shows the total number of trees recorded in grid cells of approximately 200 × 200 km. In (b–d), the density of overlapping points is reflected by a colour gradient ranging from black (low point density) to yellow (high point density). Data on mean annual rainfall and temperature show in (d) were obtained from WorldClim2 database (Fick & Hijmans, 2017) at a spatial resolution of 30 arc‐seconds (approximately 1 km). Panel (e) shows a phylogenetic tree constructed from all species in the Tallo database (n = 5163). Branch tips have been colour coded to reflect the number of trees sampled for each species and the position of several seed plant families on the tree has been labelled. The phylogenetic tree was generated using the V.PhyloMaker package in R (Jin & Qian, 2019), the backbone of which is a phylogeny of 79,881 taxa of seed plants developed by Smith and Brown (2018).