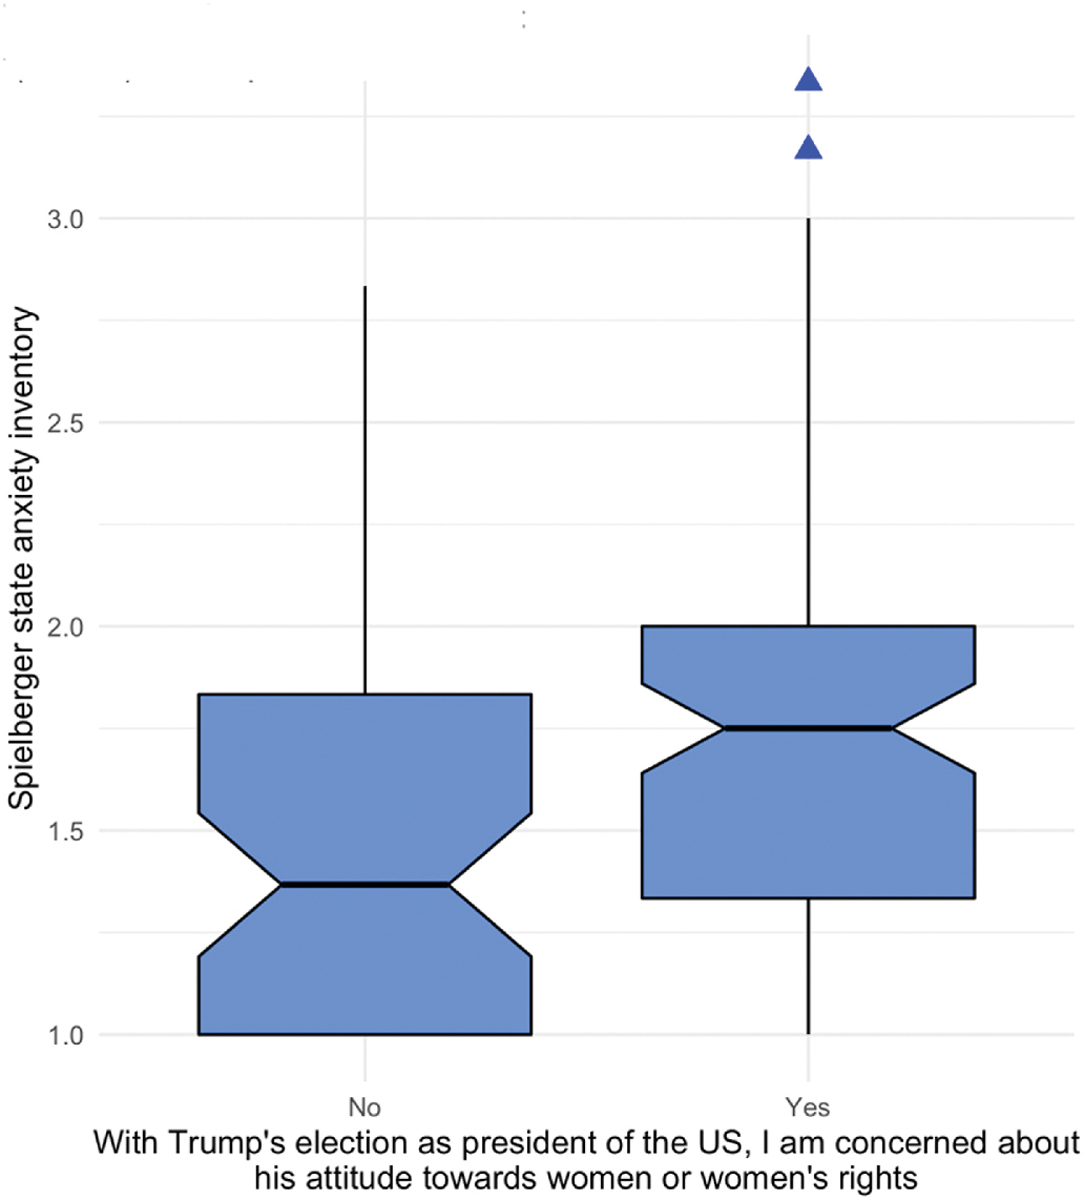
Fig. 3.

Relationship between concerns about women’s issues and state anxiety with Welch’s 2-sample 2-sided t-test results. Note. Welch’s two sample t-test 2- sided: t(109.04) = − 3.32, p = 0.001**. Upper hinge reflects the 75th percentile. Lower hinge reflects the 25th percentile. Upper whisker reflects the largest observation no further than the upper hinge +1.5 * interquartile range (IQR, i. e., distance between first and third quartiles). Lower whisker reflects the smallest observation no further than the lower hinge − 1.5 * IQR. Blue triangles reflect observations outside of this range. The notches are useful for group comparison. Because the notches of the two boxes do not overlap, “this suggests that the medians are significantly different.” (Source: https://github.com/tidyverse/ggplot2/blob/master/R/geom-boxplot.r) Upper edge of notch reflects median − 1.58 * IQR/sqrt(n). Lower edge of notch reflects median − 1.58 * IQR/sqrt(n). This approximates a 95% confidence interval for comparing medians (McGill et al., 1978).
