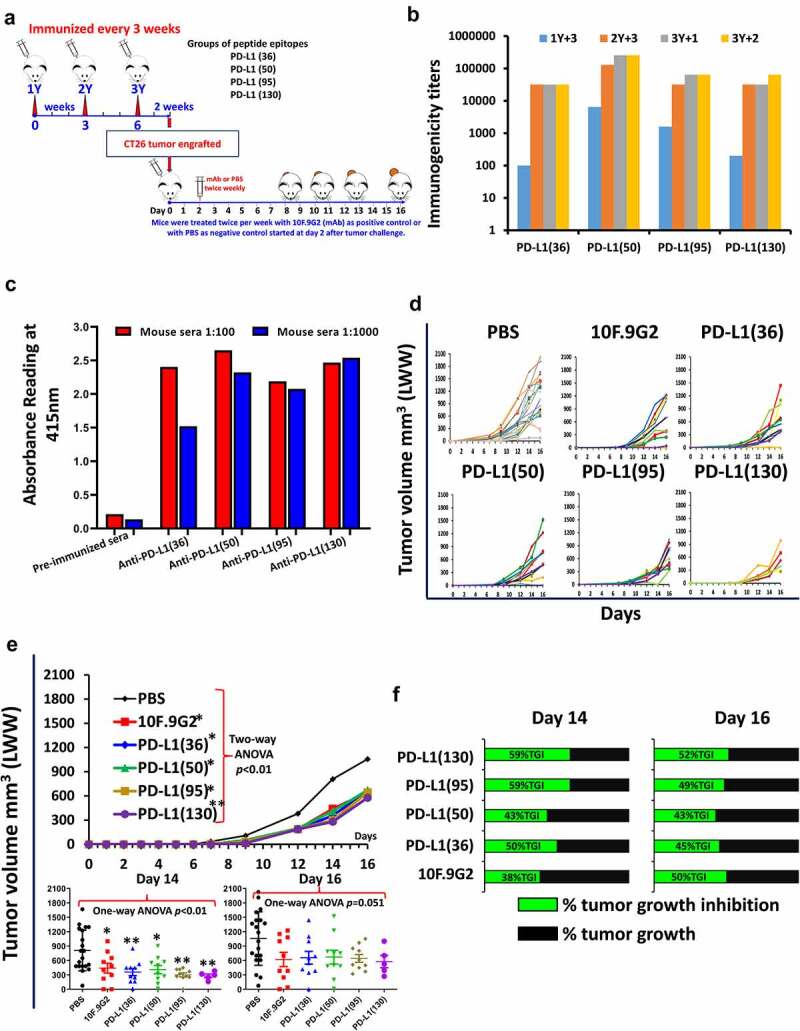
Figure 3.

Initial screening of hPD-L1 peptide epitopes in BALB/c mice syngeneic model challenged with CT26 colon carcinoma cell line. (a): Scheme of BALB/c mice vaccination and tumor engraftment. BALB/c mice (PBS, n = 20; PD-L1(130), n = 5 all other groups n = 10) 6–8 weeks old were subcutaneously immunized with MVF-peptide immunogens emulsified in ISA 720 (1:1) with 3 times and three weeks apart. Mice were immunized with 4 MVF-PD-L1 vaccine constructs [PD-L1(36–53), PD-L1(50–67), PD-L1(95–112), PD-L1(130–147)] prior to tumor challenge. Blood was collected as indicated and sera tested for antibody titers by ELISA. 2 weeks after the third immunization (3Y), the mice were engrafted subcutaneously with CT26 tumor cells 105 per mouse. Control mice were treated twice weekly with PBS as negative control or with anti-mouse PD-L1 antibody (clone 10F.9G2) as positive control starting 2 days after tumor challenge, mice were treated during the experimental period. Tumor growths were observed and measured by calipers; (b): Immunogenicity of MVF-PD-L1 peptides in BALB/c mice. Mice immunized with various peptide constructs. Sera were tittered against each individual MVF-PD-L1 peptide immunogen. (c): Antigenicity. Mouse sera tittered against rhPDL1. (d): Individual plots of tumor growths in BALB/c mice immunized with MVF-PD-L1 vaccine constructs as indicated above, anti-mouse PD-L1 antibody (clone 10F.9G2, PD-L1, B7-H1; Cat#BE0101 BioXCell, Lebanon, NH) as positive control. (PBS n = 20; PD-L1(130) n = 5; all other groups n = 10); (e): Two-way ANOVA was used to analyze the whole curves of average tumor volume growing, which shows significant difference between mAb, immunized groups versus PBS group; Plots of tumor volume LWW at day 14 and day 16 for each of group. (f): Percentage of tumor growth inhibition (%TGI) was defined as the difference between median tumor volume (MTV) of treatment group with the positive control group and the value was calculated by formula: %TGI = 100*(MTV control-MTV test)/MTV control which were calculated at day 14 and day 16. The %TGI indicate the mice immunized with MVF-PD-L1(36, 50, 95 & 130) showed higher %TGI versus mAb 10F.9G2, especially MVF-PD-L1(95 & 130) had 59% TGI at day 14, only MVF-PD-L1(130) showed 2% higher TGI compared to mAb 10F.9G2 at day 16. “Two-way ANOVA were used for two parameters between two (versus with PBS) or multiple curves comparison; one-way ANOVA followed by Tukey test were used to compare between two groups; *p < 0.05, **p < 0.01 compared with PBS group”.
