Figure 6.

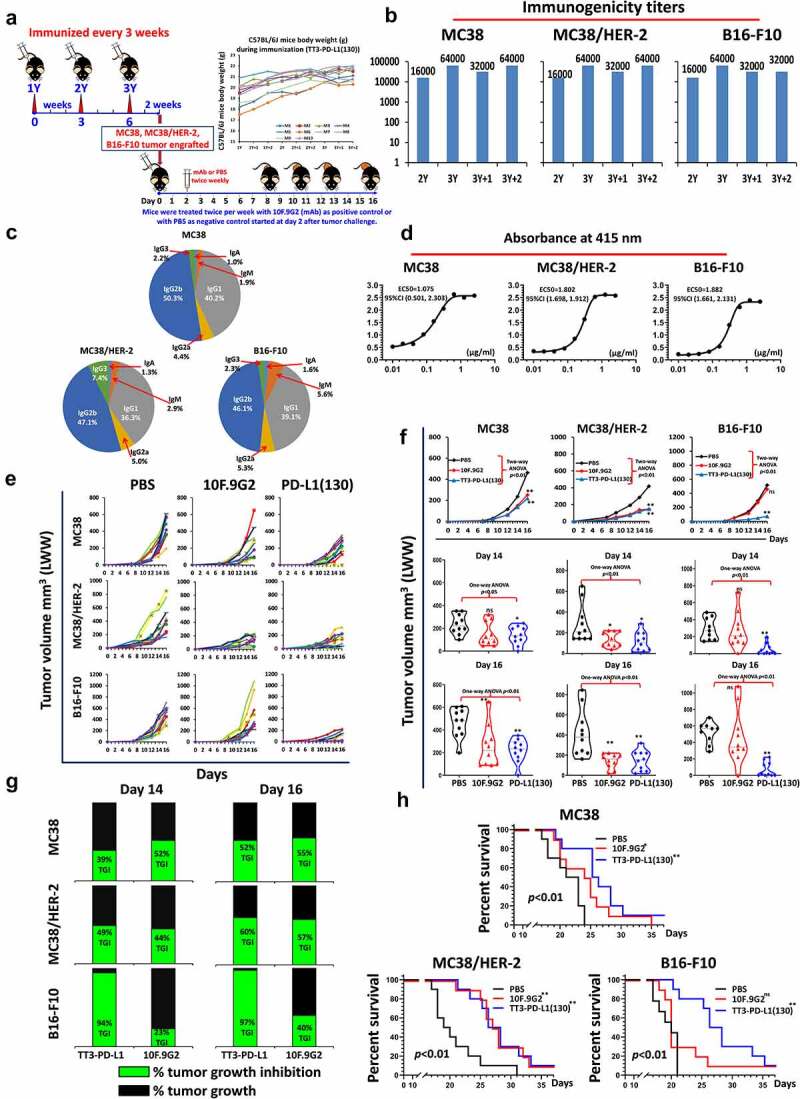
Efficacy of TT3-PD-L1(130) vaccine candidate in C57BL/6J black mice syngeneic model challenged with MC38 wild type, MC38/HER-2 and B16-F10 carcinoma cell lines. (a): Scheme of C57BL/6J mice vaccination and tumor engraftment. The mice (10 mice/gp) 6–8 weeks old were immunized with TT3-PD-L1(130) vaccine emulsified with ISA 720 vehicle. Mice were immunized three times and three weeks apart, 2 weeks after the third immunization (3Y), the mice were engrafted with 1 × 10⁵ MC38 wild-type tumor cells per mouse, 1 × 10⁵ MC38/HER-2 tumor cells per mouse or 1 × 10⁵ B16-F10 tumor cells per mouse in each group as designed. Control mice were treated twice weekly with PBS as negative control or with anti-mouse PD-L1 antibody (clone 10F.9G2) as positive control group starting on day 2 after tumor challenge, mice were treated during the experimental period. Tumor growths were observed and measured by calipers; (b): Immunogenicity of TT3-PD-L1(130) peptide epitope vaccine in C57BL/6J mice. Mice bleeds were collected as indicated after the primary immunization, and ELISA was used to detect antibody titers in sera. (c): Isotypes in C57BL/6J mice (3Y+2) after immunization with TT3-PD-L1(130) and ISA 720; (d): Antigenicity of TT3-PD-L1(130) in mice using human recombinant protein PD-L1(PDL1, PD1-H5228, HIS tag); (e): Individual plots of tumor growths in C57BL/6J mice immunized with TT3-PD-L1(130) vaccine, PBS as negative control and anti-mouse PD-L1 antibody (clone 10F.9G2) as positive control. (f): Plots of tumor volume LWW at day 14 and day 16 for MC38 wild type, MC38/HER-2 and B16-F10 models of each group. Two-way ANOVA was used to analyze the whole curves of tumor growth, which shows significant difference with p < 0.01, one-way ANOVA was used to analyze the multiple groups comparison; (g): Percentage of tumor growth inhibition (%TGI) was defined as the difference between median tumor volume (MTV) of treatment group with the PBS control group and the value was calculated by formula: %TGI = 100*(MTV control-MTV test)/MTV control which were calculated at different days as indicated in the graphs. (h): The Log-rank (Mantel-Cox) test was used to compare the survival curves in multiple groups or between two groups (compared with PBS group), *p < 0.05, **p < 0.01. Two-way ANOVA were used for two parameters between two (versus with PBS) or multiple curves comparison; one-way ANOVA followed by Tukey test were used to compare between two groups (versus with PBS group); ns indicates no significance, * indicates p < 0.05, ** indicate p < 0.01.
