Figure 3.

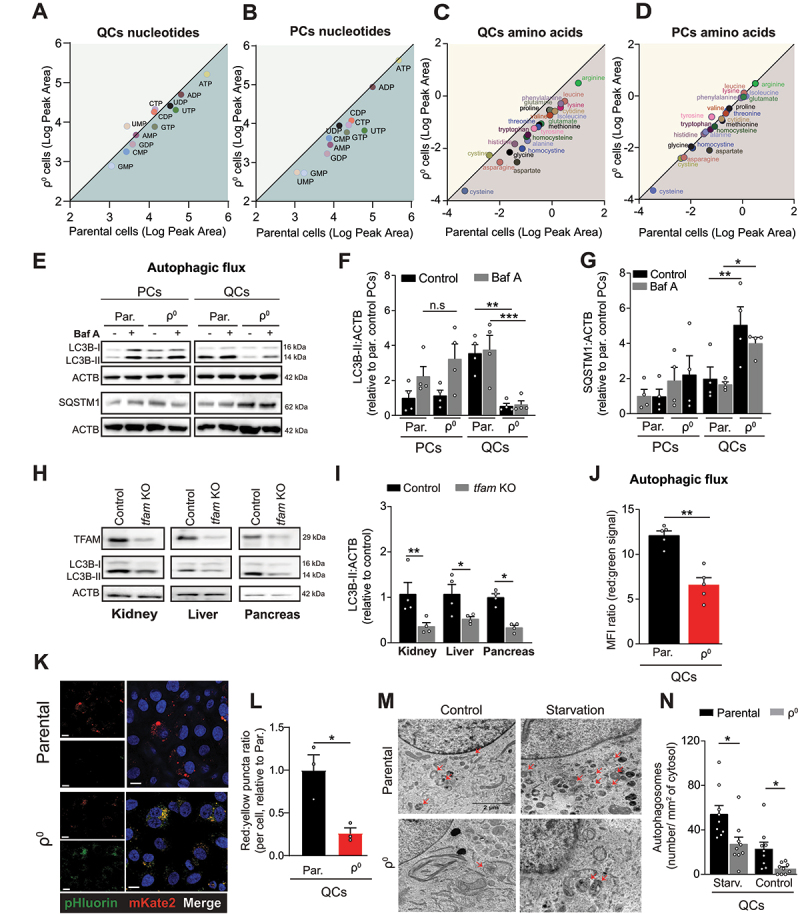
Autophagy is suppressed in OXPHOS-deficient quiescent cells and tissues. (A-D) Mass spectrometry quantification of intracellular levels of nucleotides and amino acids in parental and ρ0 EA.hy926 cells. Nucleotides QCs (A), nucleotides PCs (B), amino acids QCs (C), amino acids PCs (D). The plots show the logarithms of peak area for individual nucleotides and amino acids (mean of n > 3 independent experiments). The values below the diagonal are reduced in ρ0 compared to parental cells. (E) Representative WB images of activated LC3B (LC3B-II) and SQSTM1 in PCs and QCs in the presence or absence of 50 nM of Baf A for 4 h. (F and G) Densitometric quantification of LC3B-II (F) and SQSTM1 (G) (mean ± S.E.M., n = 4, n.s.p > 0.05, *p < 0.05, **p < 0.01, one-way ANOVA with Sidak’s multiple comparisons test). (H) Representative WB images of TFAM protein expression and activated LC3B (LC3B-II) in kidney, liver and pancreas of control and tfam KO mice. (I) Densitometric quantification of activated LC3B (LC3B-II) as in H (mean ± S.E.M, n = 4 mice, *p < 0.05, **p < 0.01, unpaired two-tailed t test). (J) Fluorescent signal of the pHluorin-mKate2-LC3 autophagy flux reporter in parental and OXPHOS deficient EA.hy926 QCs assessed by flow cytometry (mean ± S.E.M., n = 5, **p < 0.01, unpaired two-tailed t test). Note: red:green fluorescence ratio is proportional to the native autophagic flux. (K and L) Representative images pHluorin-mKate2-LC3 flux reporter (K) and quantification of LC3 puncta (L) in parental and OXPHOS deficient EA.hy926 QCs assessed by confocal microscopy. Puncta counts were normalized to the number of cells (mean ± S.E.M., n = 3, **p < 0.01, unpaired two-tailed t test). Scale bar: 40 µm. (M) Representative transmission electron microscopy images and (N) autophagosome quantification of control and starved EA.hy926 parental and ρ0 QCs cells. Autophagosomes are indicated by red arrows (n = 9 cells per condition, *p < 0.05, unpaired two-tailed t test). Scale bar: 2 µm.
