Figure 4.

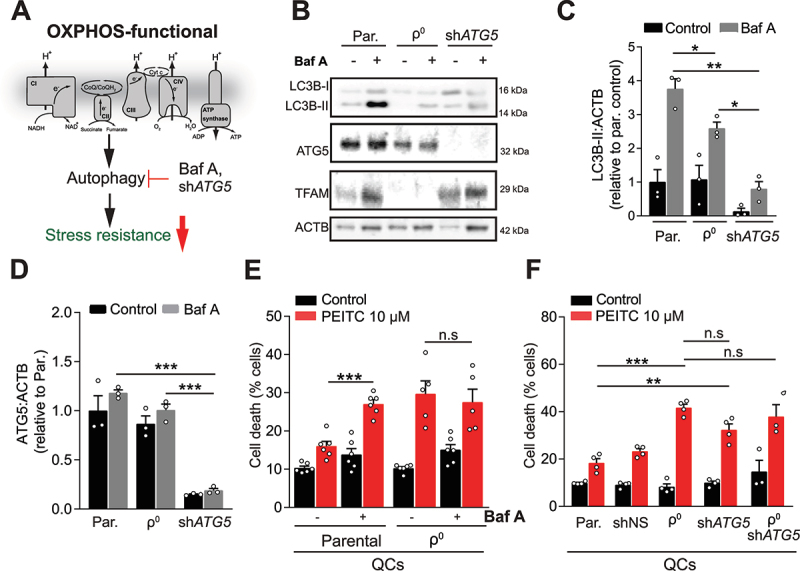
Suppression of autophagy in quiescent cells recapitulates the effects of OXPHOS deficiency on resistance to stress. (A) Pharmacological (Baf A) and genetic (shATG5) suppression of autophagy in parental QCs was used to explore its potential effects downstream of OXPHOS deficiency. (B, C, D) Representative WB images (B) and quantifications of LC3B-II (C) and ATG5 (D) in parental and ρ0 EA.hy926 QCs (mean ± S.E.M., n = 3, n.s.p > 0.05, *p < 0.05, **p < 0.01, ***p < 0.001, one-way ANOVA with Sidak’s multiple comparisons test). (E) Cell death in EA.hy926 QCs with or without OXPHOS deficiency, pre-incubated or not with 50 nM of Baf A for 2 h followed by 10 µM PEITC for 22 h, evaluated by ANXA5-FITC and PI (mean ± S.E.M., n ≥ 4, n.s.p > 0.05, ***p < 0.001, one-way ANOVA with Sidak’s multiple comparisons test). (F) Cell death in indicated EA.hy926 QCs treated with 10 µM of PEITC for 22 h, evaluated by ANXA5-FITC and PI (mean ± S.E.M., n = 4, n.s.p > 0.05, **p < 0.01, ***p < 0.001, one-way ANOVA with Sidak’s multiple comparisons test).
