Figure 7.

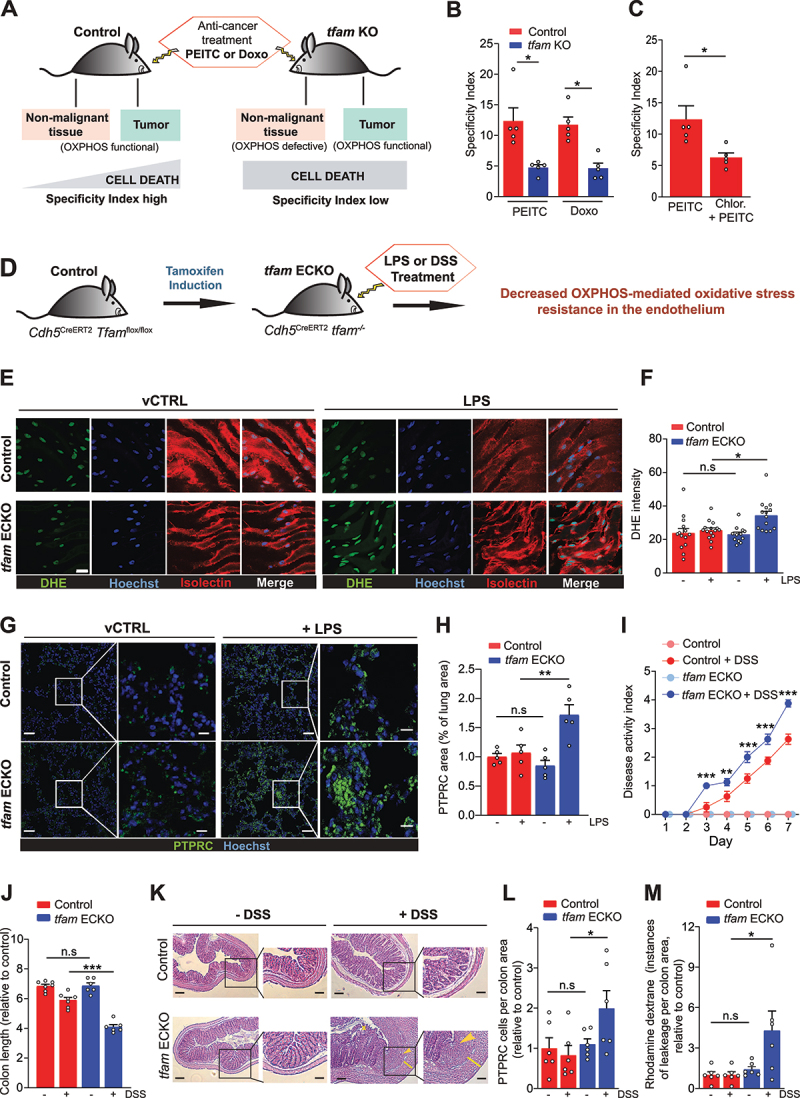
OXPHOS-mediated stress resistance during quiescence maintains therapeutic window in cancer and limits inflammation-linked pathology. (A) OXPHOS maintains therapeutic window by supporting resistance to ROS in non-malignant tissue during ROS-based cancer therapy. Treatment-induced cell death in non-malignant tissues (contain mostly QCs) is increased in tumor-bearing tfam KO mice, compromising specificity of treatment. (B) Specificity index (SI) assessed by quantification of the ratio of TUNEL+ cells in tumor and liver tissue from control and tfam KO mice after treatment with PEITC and doxorubicin (Doxo). (C) Specificity index (SI) assessed by quantification of the ratio of TUNEL+ cells in tumor and liver tissues from control mice treated with PEITC (1.25 mg/25 g mouse in corn oil) or PEITC + chloroquine (1 mg/20 g mouse in corn oil), (mean ± S.E.M., n = 5 mice per condition, *p < 0.05, **p < 0.01, one-way ANOVA with Sidak’s multiple comparisons test). (D) Endothelium-specific tfam deletion strategy in Cdh5CreERT2 Tfamflox/flox mice (referred to as tfam ECKO). (E and F) Representative images (E) and quantification (F) of aorta open book preparations from control and tfam ECKO mice treated with LPS for 4 h, stained for DHE (green), the EC marker isolectin B4 (red) and nuclei (Hoechst-blue). Scale bar: 20 µm. (n ≥ 12 mice per group, n.s.p > 0.05, *p < 0.05, one-way ANOVA with Sidak’s multiple comparisons test). (G and H) Representative images (G) and quantification (H) of lungs from control and tfam ECKO mice 4 h after injection of LPS or vehicle solution stained with PTPRC/CD45 (green) and Hoechst (blue) (n = 5 mice per group, n.s.p > 0.05, **p < 0.01, one-way ANOVA with Sidak’s multiple comparisons test). Right panels in G are magnifications of the boxed areas on the left. Scale bar: 40 µm (left panels) and 20 µm (right panels). (I) Disease activity index of colitis in control and tfam ECKO mice during treatment with 2.5% DSS in the drinking water for 7 consecutive days (n = 6 mice, ***p < 0.001, two-way ANOVA Tukey’s multiple comparisons test). (J) Colon length in control and tfam ECKO mice after 2.5% DSS treatment (n = 6; 3 males, 3 females per group), n.s.p > 0.05, **p < 0.01, ***p < 0.001, one-way ANOVA with Sidak’s multiple comparisons test). (K) Representative images of hematoxylin and eosin-stained sections of colon from control and tfam ECKO mice treated as in I. Right panels are magnifications of the respective boxed areas. Asterisks denotes loss of crypts; arrowhead denotes more severe separation of the crypt base from the muscularis mucosa, infiltrated with inflammatory cells; yellow line visualizes the thickness of the colonic wall. Scale bar: 500 µm. (L) Quantification of colon PTPRC/CD45+ cells per total area of tissue from control and tfam ECKO mice after 2.5% DSS treatment (n = 6 mice, n.s.p > 0.05, *p < 0.05, one-way ANOVA with Sidak’s multiple comparisons test). (M) Quantification of vascular leakiness (dextran-rhodamine signal) in colon from control and tfam ECKO mice after 2.5% DSS treatment (n = 6 mice, n.s.p > 0.05, *p < 0.05, one-way ANOVA with Sidak’s multiple comparisons test).
