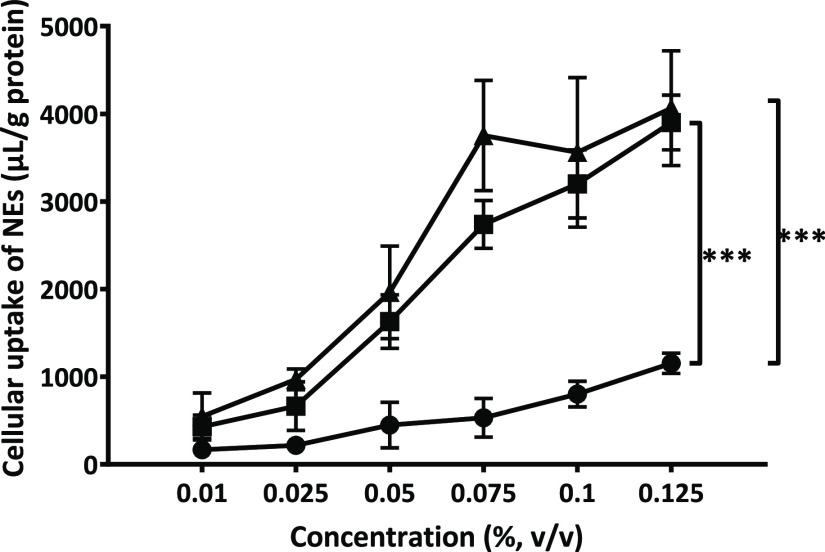
Figure 11.
Cellular uptake of NEs into 661W cells at different concentrations by fluorescence spectroscopy. Cells were incubated with PLOA-decorated NEs (▲), TPP-coated PLOA-decorated NEs (■), and control NEs (●) for 1 h. Data are expressed as means ± SD, n ≥ 3. The significant difference is indicated as ***p < 0.001.

