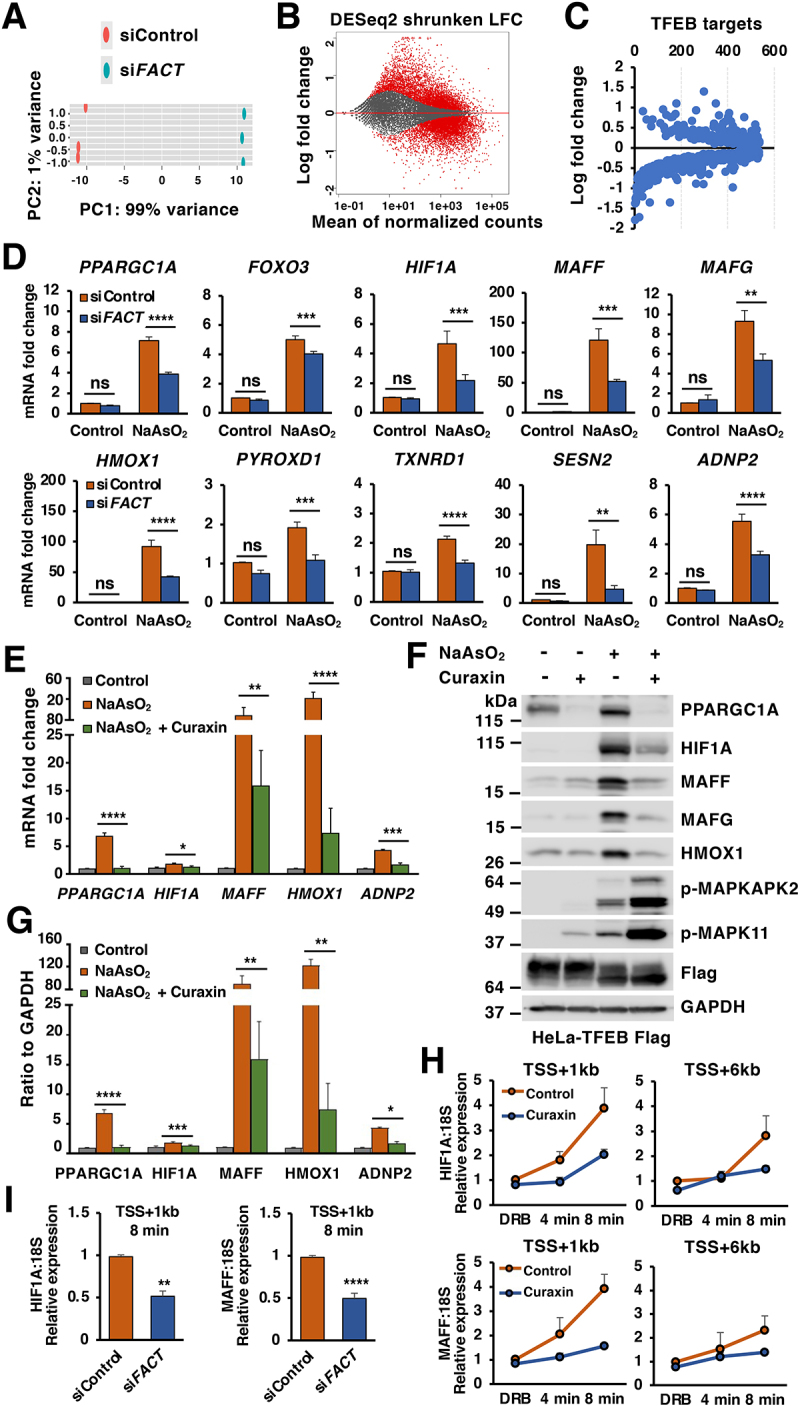
Figure 4.

The FACT complex modulates cellular response to oxidative stress. (A) Principal component analysis of genes with q-value < 0.05 reveals distinct clustering of siControl- and siFACT-treated cells upon incubation with NaAsO2 (50 μM) for 6 h. (B) Volcano plot indicating distribution of genes significantly up- and downregulated in control versus FACT complex depleted cells incubated with NaAsO2 (50 μM) for 6 h. Cutoffs indicate genes with q-value < 0.05. (C) Volcano plot indicating distribution of previously identified TFEB target genes in control versus FACT complex depleted HeLa-TFEB-Flag cells as described in (B). (D) Relative quantitative real-time PCR analysis of PPARGC1A, FOXO3, HIF1A, MAFF, MAFG, HMOX1, PYROXD1, TXNRD1, SESN2 and ADNP2 mRNA transcript levels in HeLa-TFEB-Flag cells treated with either control or FACT siRNAs upon incubation with NaAsO2 (50 μM) for 6 h. Significance tested with two-way ANOVA with Sidak’s multiple comparisons test (*p < 0.05, **p < 0.01, ***p < 0.001, ****p < 0.0001) from three independent experiments. (E) Relative quantitative real-time PCR analysis of PPARGC1A, HIF1A, MAFF, HMOX1 and ADNP2 mRNA transcript levels in HeLa-TFEB-Flag cells treated with DMSO (Control), NaAsO2 (50 μM) or NaAsO2 (50 μM) plus curaxin (1 μM) for 6 h. Data represented as geometric mean ± SD and significance tested with Student’s t-test (*p < 0.05, **p < 0.01, ***p < 0.001, ****p < 0.0001) from three independent experiments (F) Immunoblots analysis of protein lysates from HeLa-TFEB-Flag cells treated with NaAsO2 (50 μM), Curaxin (1 μM) alone or NaAsO2 (50 μM) plus curaxin (1 μM) for 6 h. (G) Quantification of immunoblots shown in (F). Data represents mean relative protein levels ± SD with n = 5. Significance tested using Student’s test (*p < 0.05, **p < 0.01, ***p < 0.001, ****p < 0.0001). (H and I) Transcription elongation rate was analyzed by relative quantitative real-time PCR for HIF1A and MAFF pre-mRNA transcript levels in HeLa-TFEB-Flag cells treated with NaAsO2 (50 μM) plus curaxin (1 μM) for 6 h (H) or siRNA transfected HeLa-TFEB-Flag cells upon NaAsO2 (50 μM) incubation for 6 h (I). Data represents mean relative protein levels ± SD with n = 4. Significance tested using Student’s test (**p < 0.01, ****p < 0.0001).
