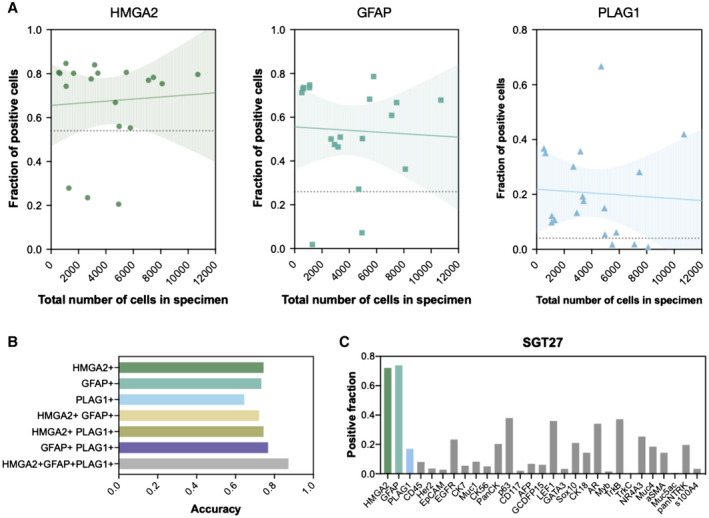
Figure 3.

Biomarkers for identification of pleomorphic adenoma. (A) The correlation between biomarker positivity and harvested cell number revealed that the 3 biomarkers for pleomorphic adenoma (PA) (HMGA2, GFAP, and PLAG1) were detected regardless of the total cell count, indicating that the sample size of a sample does not affect the diagnosis of PA within the tested range of 527 to 10,712 cells. Solid lines show fitted linear model with 95% confidence interval in the shaded area (HMGA2: R2 = 0.0004, P = .79; GFAP: R2 = 0.0003, P = .84; PLAG1: R2 = 0.003, P = .82). Dashed lines indicate the cutoff level determined as the fraction of positive cells that maximizes the sum of sensitivity and specificity of diagnoses based on the expression level of each biomarker. (B) Accuracy of PA diagnosis using single markers or combination of markers was compared. Expression levels of each of the 3 markers were quantified on both PA samples and non‐PA samples for calculation of the diagnostic accuracy (see Supporting Fig. 6 for supporting information). Diagnosis based on all 3 markers (HMGA2, GFAP, or PLAG1) showed the highest accuracy (0.82), as compared to those based on single markers (HMGA2: 0.74, GFAP: 0.73, PLAG1: 0.65) or different combinations (HMGA2/GFAP: 0.72, HMGA2/PLAG1: 0.74, GFAP/PLAG1: 0.77). (C) Multiplexed FAST‐fine‐needle aspiration analysis of a PA specimen shows the expression profile of 29 biomarkers including HMGA2, GFAP, and PLAG1. Interestingly, a fraction of cells were also positive for AR, TrkB, NR4A3, and panNTRK antibodies, arguing that no single marker is exclusively specific for a tumor type. The fraction of cells with fluorescent intensity above the intensity threshold was calculated as described in Supporting Figure 6.
