Fig. 4.

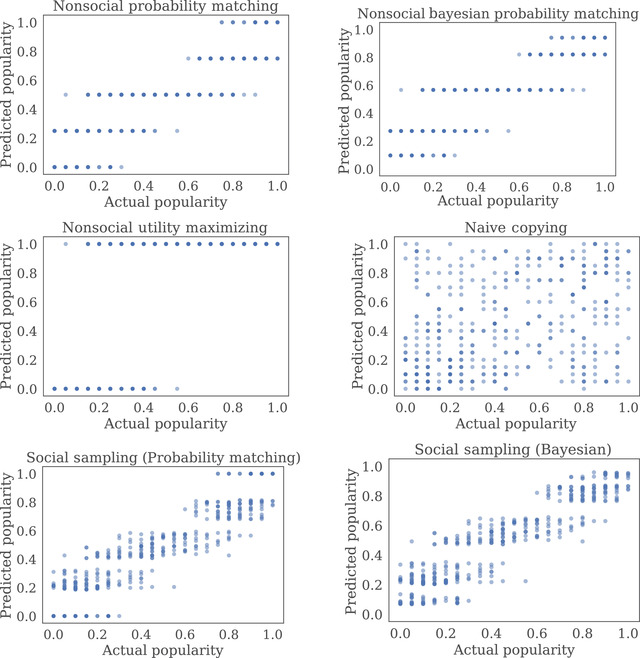
Model predictions for the three non‐social models and three social models we compared in Experiment 1. As in Fig. 3, 432 points are shown in each plot.

Model predictions for the three non‐social models and three social models we compared in Experiment 1. As in Fig. 3, 432 points are shown in each plot.