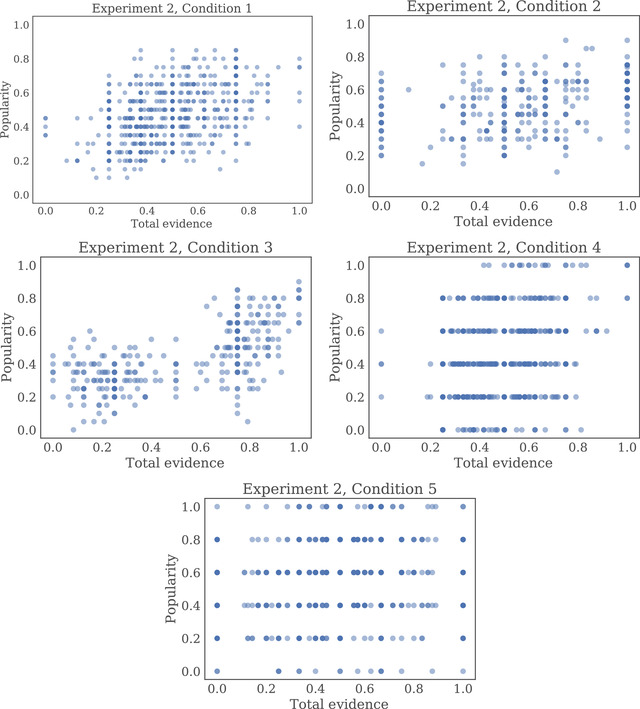
Fig. 7.

Plots showing the relationship between the total evidence available for each particular spaceship part and the proportion of participants who selected that part in Experiment 2. Each point represents one part (of eight) in one social generation (of nine) on one trial (of four) in a single repetition.
