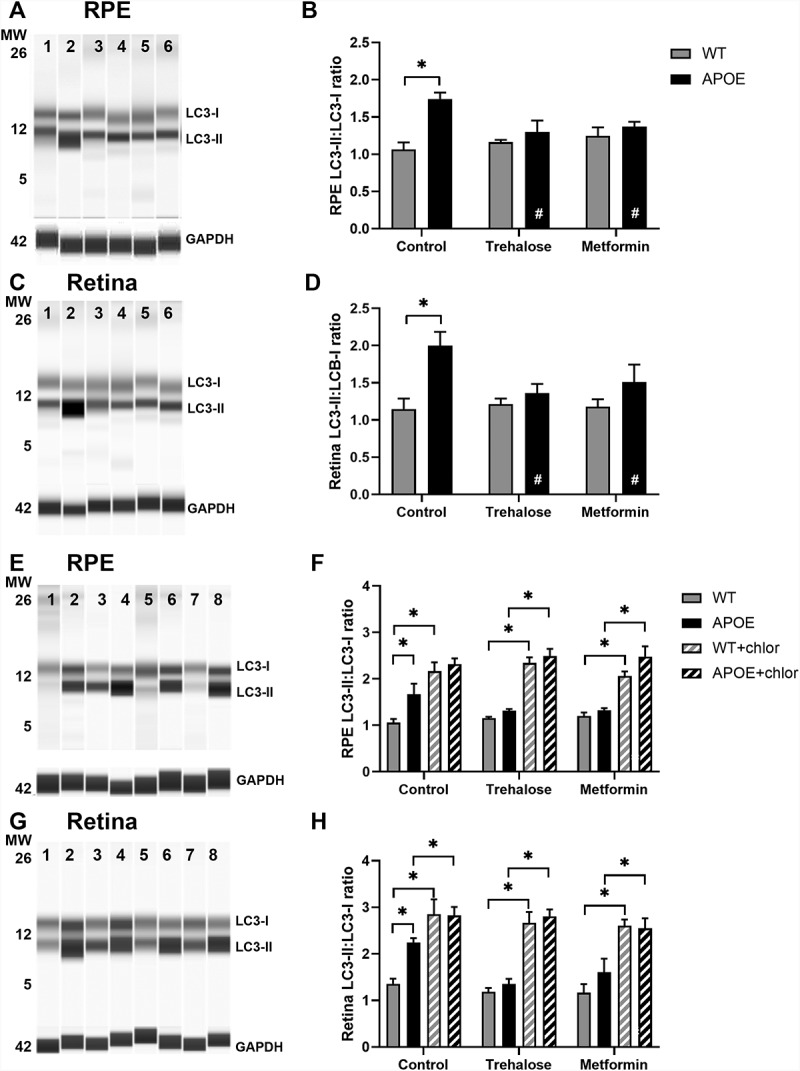
Figure 5.

Analysis of LC3 expression shows slowing of autophagy in the RPE and retina of APOE-mice, which is enhanced by treatment with trehalose and metformin. LC3 expression was assessed using simple western and the ratio of LC3-II:LC3-I used as a measure of autophagy. At 5 months of age, WT- and APOE-mice were treated with metformin (0.4 g/kg/day) or trehalose (3 g/kg/day) provided in the drinking water, while sham controls received standard drinking water. At 13 months of age, (A-B) RPE and (C-D) retina samples were analyzed for LC3B. GAPDH was used as a protein loading control. Representative lane results for (A) RPE and (C) retina are presented: MW, molecular weight marker; 1, WT-control; 2, APOE-control; 3, WT-trehalose; 4, APOE-trehalose; 5, WT-metformin; and 6, APOE-metformin. In both (B) RPE and (D) retina, the LC3-II:LC3-I ratio was higher in APOE-mice suggesting a slowing of autophagy. In APOE animals treated with trehalose or metformin the ratio of LC3-II:LC3-I was restored to WT levels. (E-H) To assess autophagy flux, experiments to block autophagy-lysosomal degradation were completed using chloroquine. At 5 months of age, WT- and APOE-mice were treated for 2 weeks with metformin or trehalose and then retinae and RPE/choroid/sclera complex were incubated in culture media with or without 50 µM chloroquine for 24 h. Example results for E) RPE and (G) retina from WT and APOE mice are presented: Lanes 1, WT-control; 2, WT-control + chloroquine, 3, APOE-control; 4, APOE-control + chloroquine; 5, APOE-trehalose; 6, APOE-trehalose + chloroquine; 7, APOE-metformin; 8, APOE-metformin + chloroquine. The LC3-II:LC3-I ratio in (F) RPE and (H) retinal samples increased significantly in all samples treated with chloroquine to block autophagy-lysosomal function. For all groups, n = 5; Two way ANOVA with post-hoc significance of p < 0.05 (*).
