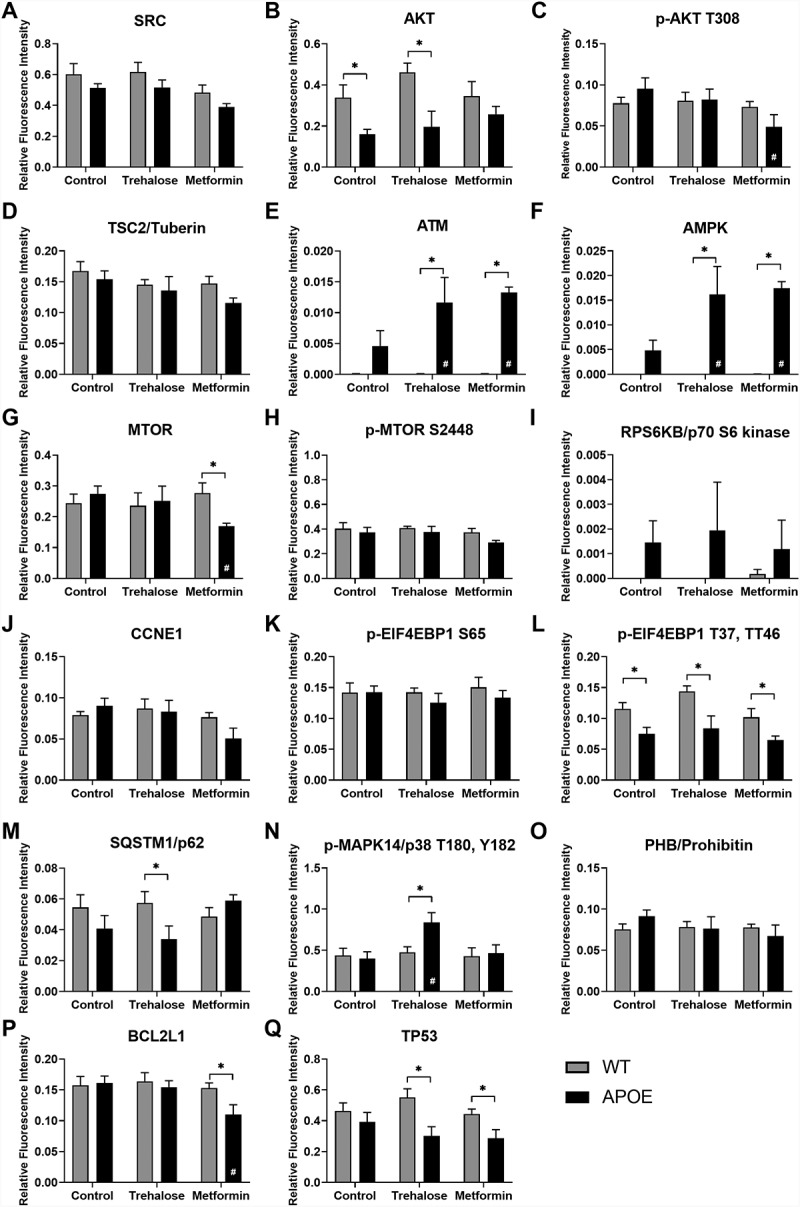
Figure 6.

Protein array analysis of autophagy pathways in the RPE. Reverse phase protein array analysis was used to quantify protein expression changes in the autophagy pathways in the RPE from WT- (gray bars) and APOE-mice (black bars) treated with trehalose and metformin. Results are shown for (A) SRC, (B) AKT, (C) AKT phosphorylated at T306, (D) TSC2/tuberin, (E) ATM, (F) AMPK, (G) MTOR, (H) MTOR phosphorylated at S2448, (I) RPS6KB/p70 S6 kinase, (J) CCNE1, (K-L) EIF4EBP1 phophorylated at (K) S65 and (L) T37, T46, (M) SQSTM1/p62, (N) MAPK14/p38 phosphorylated at T180, (O) PHB, (P) BCL2L1, and (Q) TP53. For all groups, n = 5; Two way ANOVA with post-hoc significance of p < 0.05 shown for genotype (*) and treatment (#).
