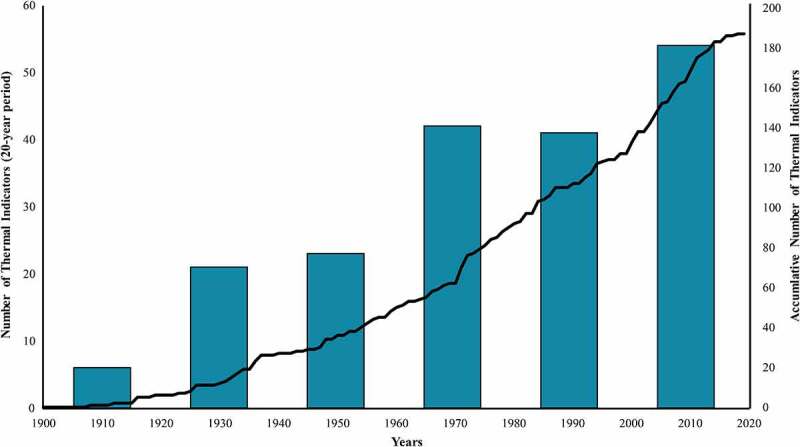
Figure 3.

Development of the 187 thermal stress indicators (TSIs) that use only meteorological data. Bars represent the number of indices developed in chronological groups of 20 years. The black line indicates the cumulative number of TSIs developed during the last 120 years.
