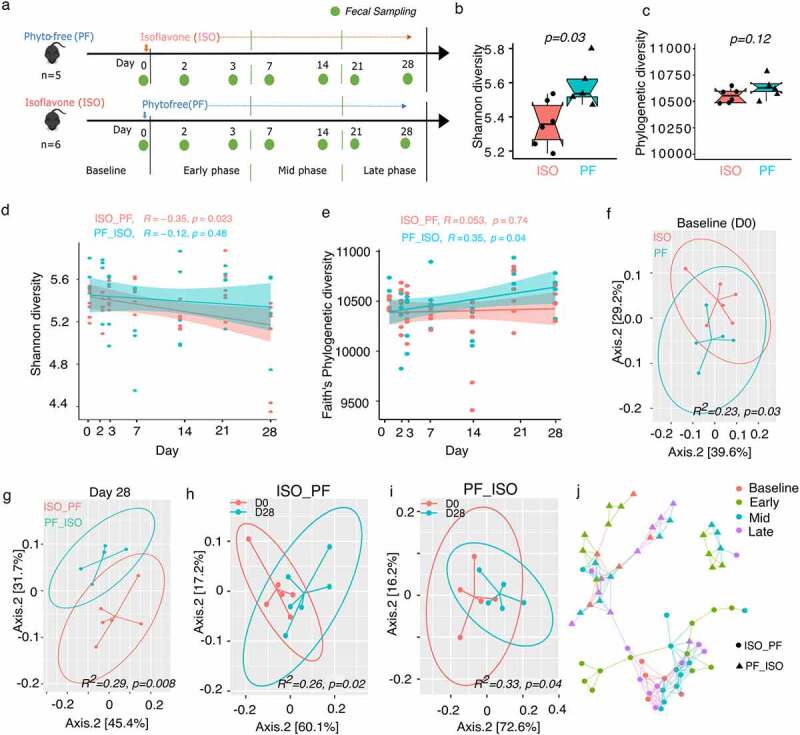
Figure 1.

Diet change alters community composition and richness. a) Experimental schematic outline for diet change and fecal sample collection. Alpha diversity measures b) Shannon diversity c) Faith’s Phylogenetic diversity pre-diet change on day 0 (D0) from isoflavone-rich (ISO) to phyto-free (PF) or vice versa. d) Shannon diversity and e) Faith’s phylogenetic diversity changes after the diet was switched from PF to ISO or vice versa. Beta diversity at f) baseline (D0) and g) day 28 after diet change measured using weighted unifrac distance metrics. Beta diversity between D0 and day 28 (D28) for diet change from h) ISO to PF and i) PF to ISO. adonis2 test was performed to for statistical differentiation between the groups for beta diversity analysis. j) A network created using Jaccard dissimilarity matrix between the samples over time. The colors represent the different phases of microbial community change over time and the shape represents the change in diet.
