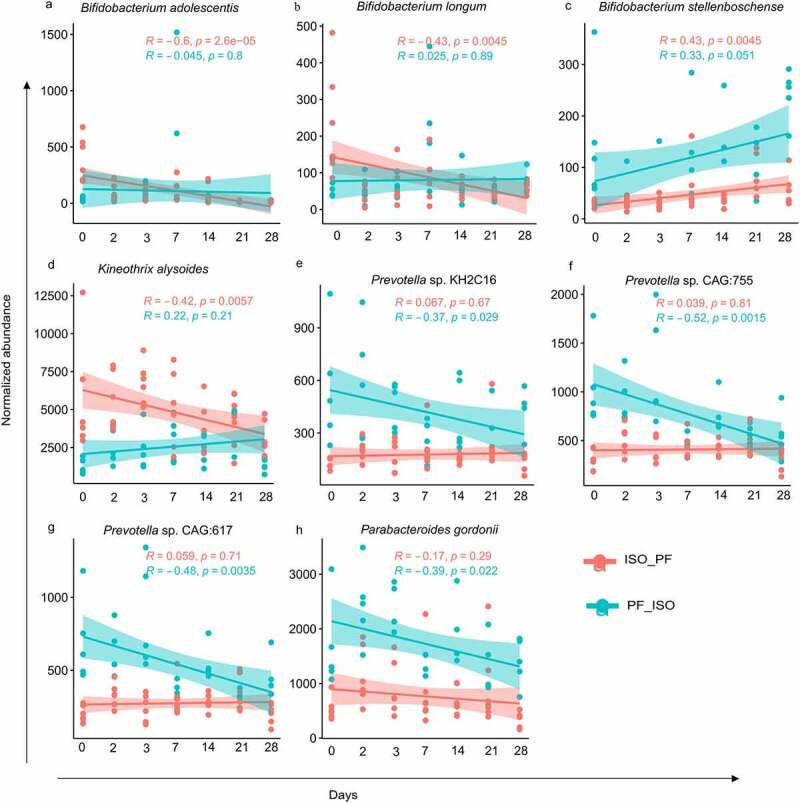
Figure 3.

Scatterplots displaying correlation of normalized abundance of significantly altering taxa over time after the change from isoflavone-rich to phyto-free (ISO_PF) and phyto-free to isoflavone-rich (PF_ISO) diet. A positive or negative correlation is expressed by the values of correlation coefficient “R” calculated using the “Pearson” method with corresponding p values for both dietary changes.
