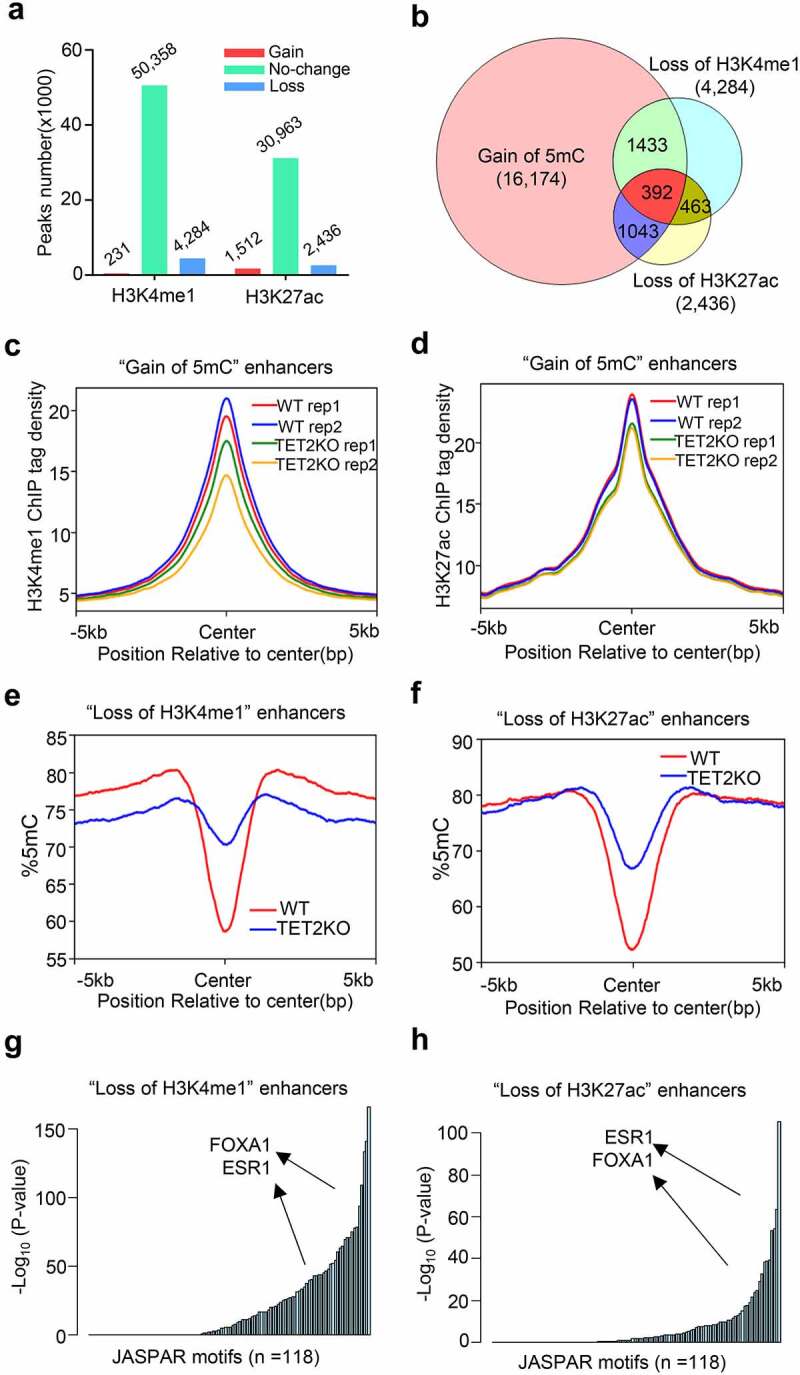
Figure 3.

TET2 depletion leads to epigenetic reprogramming of enhancers. (a) Bar plot showing the numbers of differential enriched H3K4me1 and H3K27ac peaks in TET2 KO MCF7 cells compared with WT MCF7 cells. (b) Venn diagram showing the overlapping of ‘gain of 5mC’ enhancers, ‘loss of H3K4me1’ peaks, and ‘loss of H3K27ac’ peaks. (c-d) Profile plot of the average 5mC signal on enhancers with ‘loss of H3K4me1’ (c) and ‘loss of H3K27ac’ (d) peaks in WT (red line) and TET2 KO (blue line) MCF7 cells. (e-f) Profile plot of the average H3K4me1(e) and H3K27ac(f) tag density on ‘gain of 5mC’ enhancers in WT (red line and blue line, two replicates) and TET2 KO (green line and Orange line, two replicates) MCF7 cells. (g-h) Representation of TF binding motifs overrepresented on the ‘loss of H3K4me1’ (g) and ‘loss of H3K27ac’ (h) enhancers. Human promoters were used as the comparison library.
