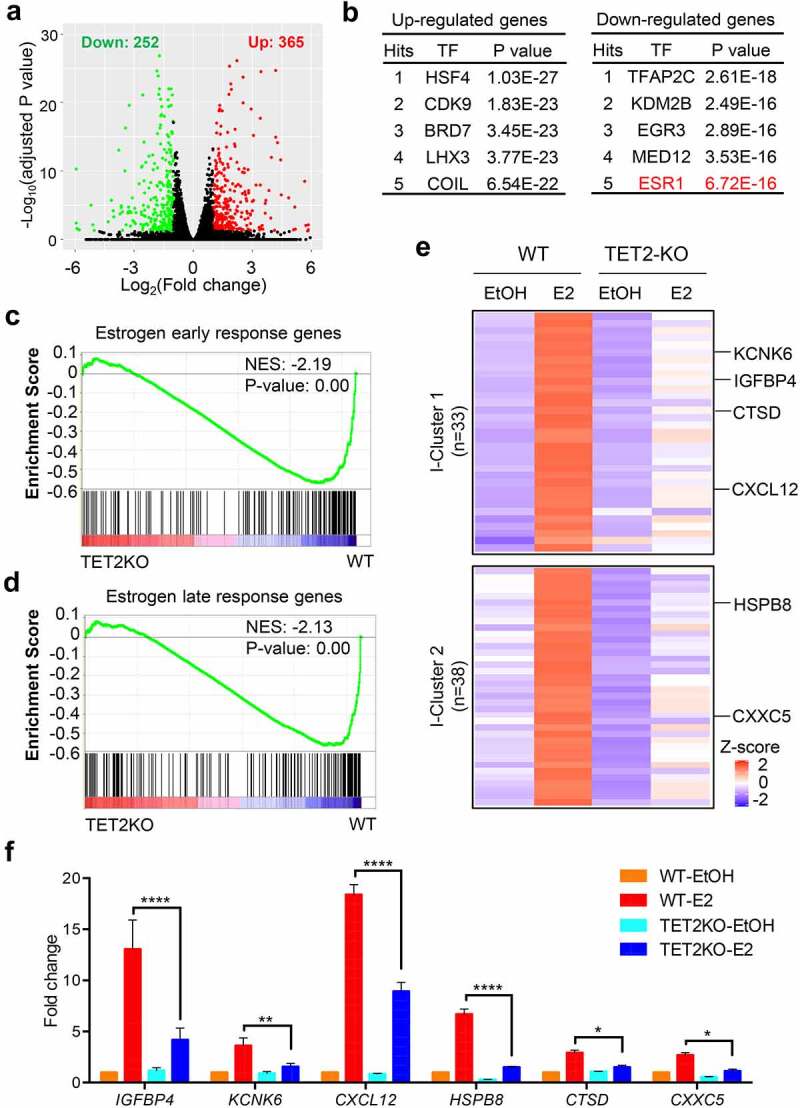
Figure 4.

TET2 loss dampens E2-induced transcription of a subgroup of ERα target genes. (a) Volcano plot of DEGs (adjusted P value < 0.05, log2(Fold change) ≥1 or ≤-1) in WT and TET2 KO MCF7 cells showing the number of down- (green point) and up-regulated (red point) genes. Each gene is represented by one point on the plot. n = 2. (b) Top 5 hits of TFs that may regulate the up-regulated (Left) or down-regulated (Right) DEGs between TET2 KO and WT MCF7 cells. (c-d) GSEA analysis of TET2 KO versus WT RNA-seq in MCF7 cells using gene signatures of ‘Estrogen early response genes’ (c) or ‘lEstrogen late response genes.’ Normalized enrichment score (NES) and nominal p-value were provided according to GSEA. (e) Heatmap representation of E2-upregulated genes that were dampened by TET2 loss. I-Cluster 1 represents the genes with difference only in the E2-stimulated condition. I-Cluster 2 represents the genes with difference in both the hormone-depleted and E2-stimulated conditions. (f) RT-qPCR analysis of six representative genes with attenuated response to E2-induced upregulation in MCF7 cells upon TET2 depletion.
