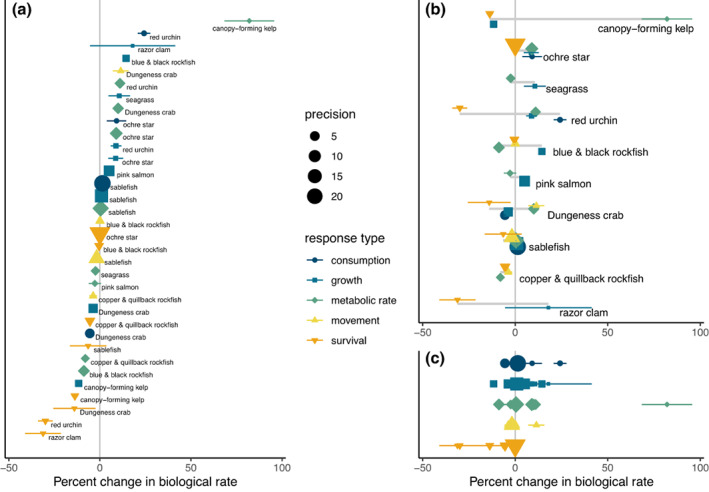
FIGURE 3.

Weighted mean responses within species and response types from meta‐analyses, displayed three ways. Points represent aggregated responses to all four environmental variables across the relevant layers for each taxon in the model domain, separated by response type. Means were weighted by precision of estimates from each individual study. Colored horizontal bars indicate 95% CI of each sensitivity based on meta‐analysis results, and the size of each point indicates precision (1/SE of weighted mean), with larger points indicating higher precision. In (a), results are shown in order of mean response, regardless of response type and taxon; in (b), responses are organized by taxon, with gray horizontal bar indicating the span of mean responses within each taxon, and in (c), responses are organized by response type.
