
Figure 1.
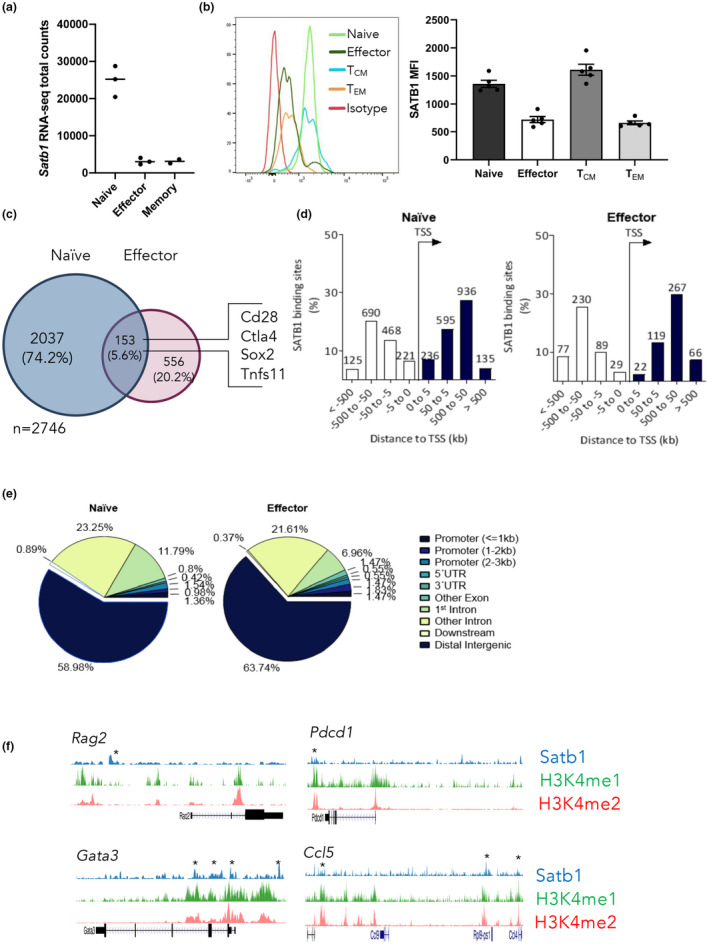
Special AT‐binding protein 1 (SATB1) is expressed in naïve CD8+ T cells and downregulated upon differentiation. (a) Analysis of RNA sequencing data 18 comparing SATB1 transcript levels in naïve (CD44loCD62Lhi), effector (day 10 after infection, tetramer+CD8+) and memory (tetramer+CD44hiCD62Llo; > day 60) CD8+ T cells before and after 5‐h peptide stimulation. (b) Protein expression of SATB1 in naïve, effector and memory including effector memory T cell or central memory T cell (tetramer+CD44hiCD62Lhi) CD8+ T cells. (c) SATB1 chromatin immunoprecipitation sequencing (ChIP‐seq) was carried out on pooled naïve (3) (CD44loCD62Lhi) or tetramer+ CD8+ influenza A virus–specific CD8+ T cells (10 mice/pool) in duplicate. Data were mapped back to the mouse genome (version mm10) and SATB1 peaks called. The number of peaks observed in naïve, effector or naïve and effector CD8+ T cells is shown. (d, e) SATB1 peaks identified in naïve or effector CD8+ T cells were mapped to the mouse genome and the distance (d) to the nearest neighboring transcriptional start site, and the type of genomic region (e) was determined. (f) SATB1‐binding tracks are shown overlaid with H3K4me1 and H3K4me2 ChIP‐seq data from naïve or effector CD8+ T cells. 21 Error bars show mean ± s.d. An unpaired t‐test was used. *P ≥ 0.05. [Colour figure can be viewed at wileyonlinelibrary.com]