Figure 3.

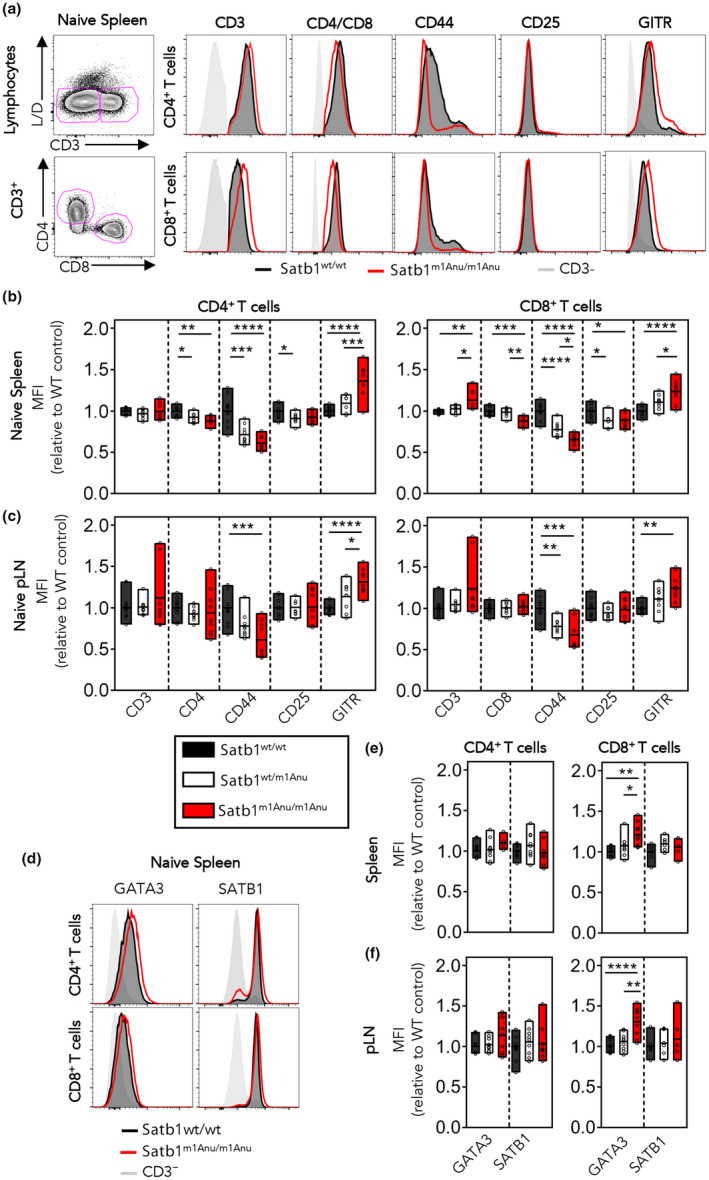
Dysregulated expression of cell surface proteins within Satb1m1Anu/m1Anu T cells. (a) Representative flow cytometry plots and histograms for CD3, CD4 or CD8 with CD44, CD25 and GITR on lymphocytes from the spleen of naïve SATB1+/+, Satb1m1Anu/+ and Satb1m1Anu/m1Anu1 mice. (b, c) Fold change in mean fluorescence intensity (MFI) of cell surface markers on CD4+ or CD8+ T cells from the spleen (b) or lymph node (c). (d) Representative histograms of GATA3 and SATB1 expression within naïve CD4+ or CD8+ T cells, or CD3− lymphocytes. (e, f) Fold change in GATA3 and SATB1 MFI within CD4+ or CD8+ T cells from the spleen (e) or lymph node (f) from wild‐type (WT), Satb1m1Anu/+ or Satb1m1Anu/m1Anu1 mice. Error bars show mean ± s.d. of three or five mice from two independent experiments. Unpaired Student's t‐tests were used. *P < 0.05, **P < 0.01, ***P < 0.001, ****P ≤ 0.0001. pLN, popliteal lymph node; SATB1, special AT‐binding protein 1. [Colour figure can be viewed at wileyonlinelibrary.com]
