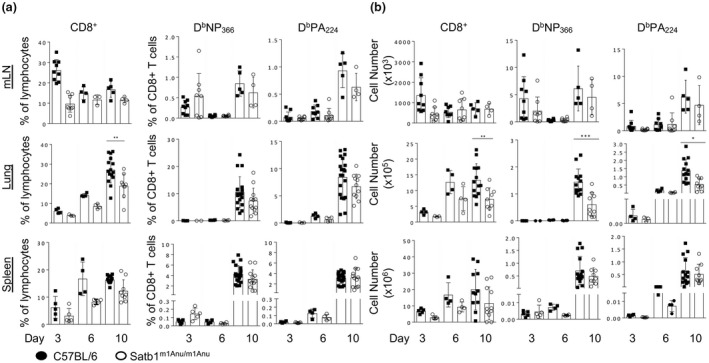
Figure 6.

Analysis of primary influenza A virus–specific CD8+ T‐cell responses in wild‐type (WT) and Satb1m1Anu/m1Anu mice. WT and Satb1m1Anu/m1Anu mice were infected intranasally with A/HKx31 and lymphocytes from the mediastinal lymph node (mLN), lung tissue and spleen were analyzed. The (a) proportion and (b) total number of CD8+, DbNP366‐ and DbPA224‐specific CD8+ T cells in mLN, lung and spleen 3, 6 and 10 days after primary infection. Error bars show mean ± s.d. of five mice from two independent experiments. Unpaired Student's t‐tests were used. *P ≤ 0.05, **P ≤ 0.01, ***P ≤ 0.001. SATB1, special AT‐binding protein 1.
