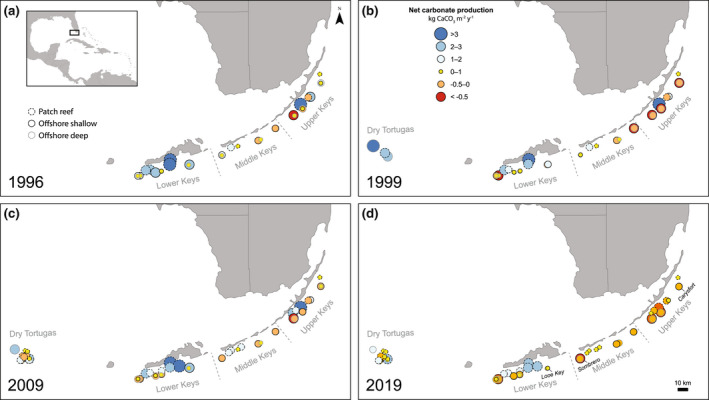
FIGURE 1.

Changes in net carbonate production (kg CaCO3 m−2 year−1) from 1996 to 2019 at the 46 study sites throughout the Florida Keys reef tract. The outline of the points is formatted to differentiate the three habitat types: patch (dashed lines), offshore shallow (solid black lines), and offshore deep (solid gray lines) reefs. The three sites that are included in the Mission: Iconic Reefs restoration initiative (NOAA, 2021) are labeled in 2019 (panel d). Note that new sites were added over time (see Supplementary Methods). Map image is the intellectual property of Esri and is used herein under license. Copyright 2020 Esri and its licensors. All rights reserved.
