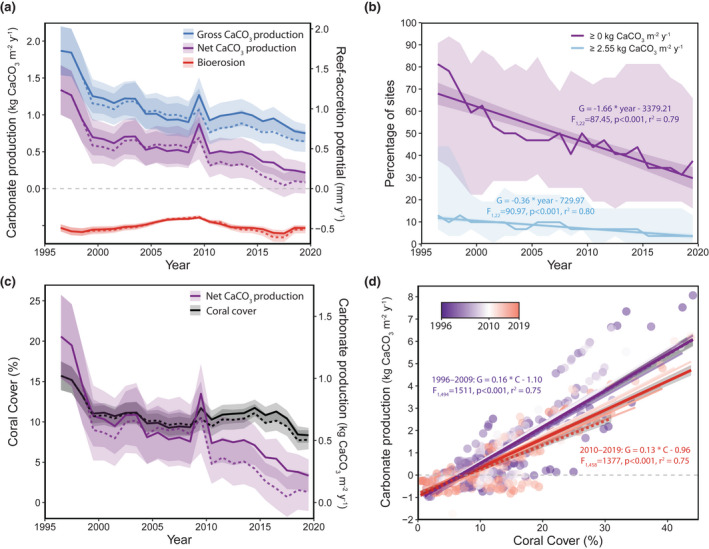
FIGURE 2.

Regional changes in carbonate budgets from 1996 to 2019. (a) Changes in mean (lines) ± standard error (SE; shaded area) gross carbonate production (blue), bioerosion (red), net carbonate production (purple), and reef‐accretion potential (purple; secondary y‐axis) regionwide (site‐level budgets are plotted in Figures S2–S4). (b) Trends in the mean (solid lines) ± SE (shading) percentage of the 32 sites surveyed from 1996 to 2019 with net carbonate production (G) that was positive (purple) or at least as high as the western Atlantic mean of 2.55 kg m−2 year−1 (Perry et al., 2018) over time. (c) Changes in mean (lines) ± SE (shaded area) coral cover (black) and net carbonate production (purple). (d) Relationship between coral cover (C) and net carbonate production (G) from 1996 to 2009 (purple lines and points) and from 2010 to 2019 (red lines and points). Thin lines represent individual years and thick lines with shading (± SE) summarize how the relationship changed between those periods. In panels (a, c, and d), solid lines (and solid points in d) represent annual means for all 46 sites, whereas dashed lines are annual means for the 32 sites that were surveyed annually from 1996 to 2019. We note that the apparent increase in coral cover in panel (c) and, therefore, carbonate production (panels a and c) in 2009 is primarily an artifact of the addition of six new patch‐reef sites with relatively high coral cover in that year (see Supplementary Results & Discussion). Annual means ± SE were calculated using site‐level means.
