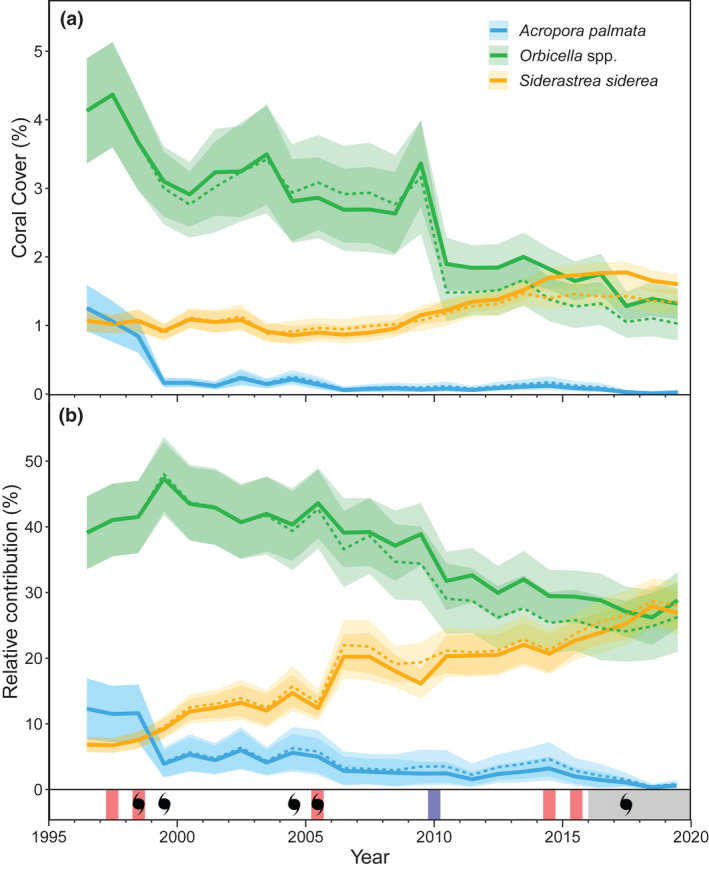
FIGURE 3.

Trends in mean (solid lines) ± standard error (SE; shaded areas) (a) percent cover of A. palmata, Orbicella spp., and S. siderea and (b) their relative percent contribution to gross carbonate production. The timing of major high (red) and low (blue) thermal‐stress events, category 1–5 hurricanes (hurricane symbol), and the outbreak of SCTLD (gray shading) in the Florida Keys are shown on the bottom panel. Four separate hurricanes impacted the Florida Keys in 2005. Solid lines represent annual means for all 46 sites, whereas dashed lines are annual means for the 32 sites that were surveyed annually from 1996 to 2019. We note that the apparent increase in Orbicella spp. production in 2009 (a) is primarily an artifact of the addition of six new patch‐reef sites with relatively high coral cover in that year (see Supplementary Results & Discussion).
